
- Bitcoin’s run at new ATH fades near key resistance despite adding 9% in May, up 11% YoY, after 120% surge in 2024.
- Cathie Wood’s ARK projects $1.5 million Bitcoin by 2030, MicroStrategy CEO Michael Saylor sees $13 million in 21 years.
- “Sell in May and go away” may not hold true but stellar rally is unlikely.
- Recent risk-on tests BTC bulls near technical resistance, but on-chain data, ETF flows and industry optimism favor upside bias.
Bitcoin (BTC/USD) grabs attention in May after breaking a key resistance on its way to a potential all-time high (ATH), though it stalls around the yearly trend line hurdle. Alongside this momentum, the “Sell in May and Go Away” adage, as well as shifts in Bitcoin’s market appeal and position squaring, keep BTCUSD in focus.
Bitcoin, the world’s largest cryptocurrency, gains nearly 9% in May, recovering from a two-day dip near $103,800, up 11% since May 2024, and following a 120% surge in 2024.
Bitcoin Price Performance
Despite occasional setbacks—in 2014, 2018, and 2022—BTC/USD has maintained a long-term upward trajectory since its inception in 2011. Over the past five years, prices have averaged an impressive 155% annual gain.
For 2025, Bitcoin prices were mostly firmer and marked a fresh record top. Following a pullback from late January to early April, driven by long liquidations after hitting record highs, Bitcoin regained momentum, driving prices toward a new all-time high (ATH), though recent upside has shown signs of stalling.
Overall, the industry optimism backed by Trump, a jump in the ETF inflows and BTC’s “digital gold 2.0” appeal seems to have favored buyers of late.
Bitcoin Technical Analysis
Source:Tradingview
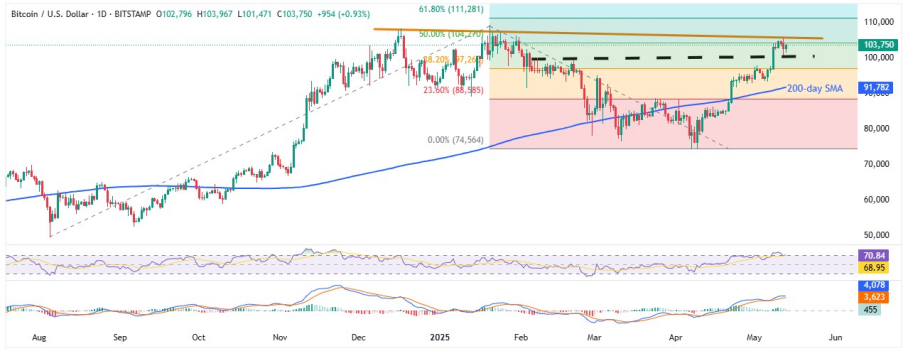
BTC/USD’s decisive breakout above the three-month horizontal resistance zone of $99,500–$100,200, along with sustained trading above the 200-day Simple Moving Average (SMA), keeps bullish sentiment intact. However, overbought conditions in the 14-day Relative Strength Index (RSI) and a five-month trendline resistance still pose challenges for the bulls.
This setup underscores the importance of the $106,000 resistance level, which must be cleared before retesting the recent high of $109,360. If bullish momentum holds, further upside targets include the 61.8% Fibonacci Extension (FE) of the August 2024 to April 2025 move at approximately $111,280, and the psychological $120,000 mark—potential stepping stones toward a new all-time high.
On the flip side, if a pullback occurs, sellers could aim for the 38.2% FE level near $97,200, followed by the 200-day SMA support at $91,600.
Bitcoin Support and Resistance Levels (May 2025)
| Type | Level | Significance |
| Resistance | $120,000 | Key round figure |
| Resistance | $111,000 | 61.8% FE of August-April move |
| Resistance | $109,000 | All-time high |
| Resistance | $106,000 | Psychological level (last tested late February) |
| Support | $99,500 | Three-month-long support zone |
| Support | $97,200 | 38.2% FE |
| Support | $91,600 | 200-day SMA |
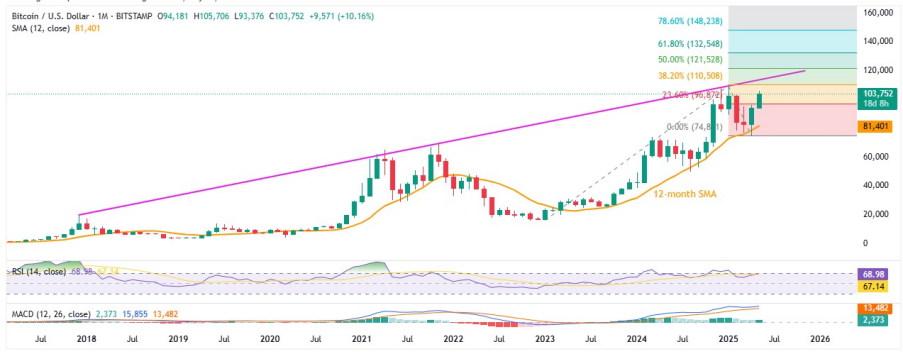
BTC/USD: Monthly chart signals sustained bullish bias Bitcoin Support and Resistance Levels (May 2025)
Source:Tradingview
Unlike the short-term chart, the monthly BTC/USD chart highlights the $114K level as a major resistance for bulls, aligned with an ascending trendline extending from December 2017. On the downside, the 12-month Simple Moving Average (SMA), near $81,500, may serve as strong support during periods of heavy long liquidations.
A confirmed breakout above $114K could open the door for further gains toward key Fibonacci Extension (FE) levels—around $121.5K (50%), $132.5K (61.8%), and $148K (78.6%).
Conversely, a break below $81,500 could expose the pair to deeper losses, targeting the early 2021 high near $64.5K and potentially the late 2024 low around $49.5K.
It’s also worth noting that the RSI (14) is approaching overbought territory, while bullish momentum in the MACD is softening. Together, these indicators suggest Bitcoin may face a gradual and potentially limited rise as it approaches the critical $114K resistance.
Bitcoin Support and Resistance Levels for 2025
| Type | Level | Significance |
| Resistance | $148,000 | 78.6% FE |
| Resistance | $132,500 | 61.8% FE |
| Resistance | $121,500 | 50% FE of 2023-25 moves |
| Resistance | $114,000 | Multi-month-old trend line resistance |
| Support | $81,500 | 12-month SMA |
| Support | $64,500 | Early 2021 peak |
| Support | $49,500 | Late 2024 bottom |
Bitcoin seasonal moves, on-chain data and position figures
After reviewing Bitcoin’s overall price performance and technical trends, it’s time to focus on key BTC/USD statistics. Notably, the monthly performance chart stands out, highlighting a seasonal dip in June that warrants close attention

Source: Coinglass.com
According to data from Coinglass.com, the adage “Sell in May and Go Away” holds little weight for Bitcoin in recent years. Since 2013, the crypto major has delivered average returns of 8.0% in May, with a median of 9.5%. June, however, tends to be less favorable, showing negative returns on both an average and median basis—hinting at a higher likelihood of a price pullback.
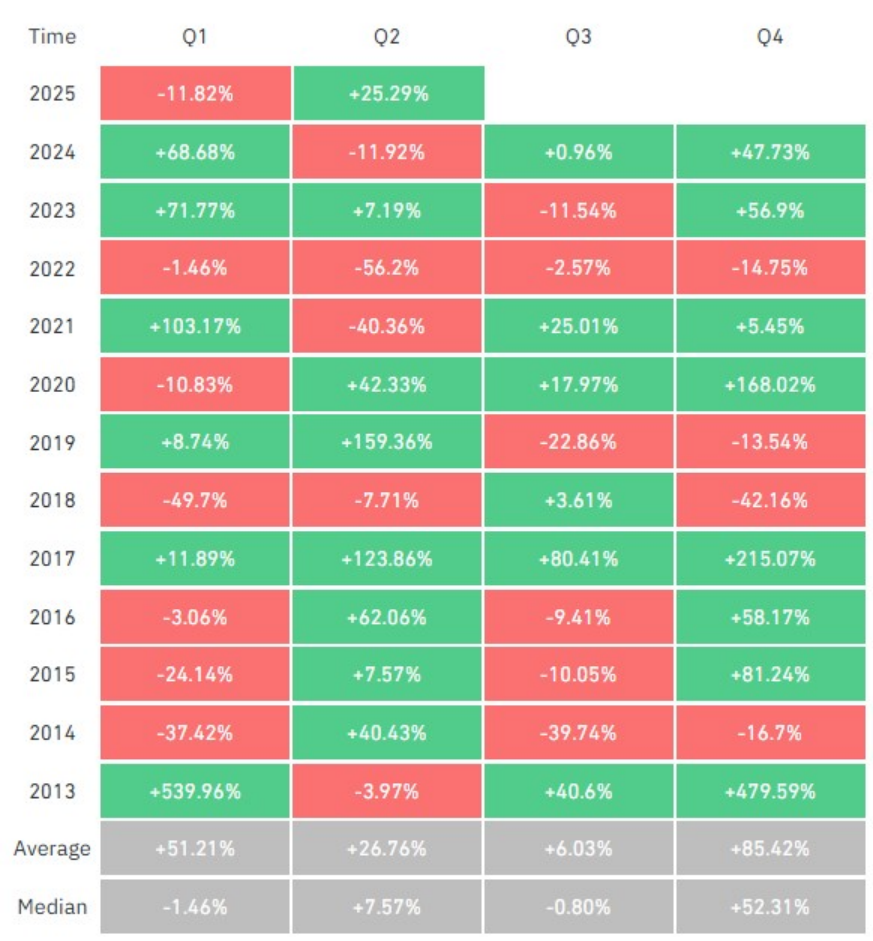
Bitcoin: Historical Quarterly Returns
Source: Coinglass.com
Digital Gold 2.0 consensus
Historically, Bitcoin’s Q2 performance has been strong, with an average return of 26% and a median of 7.6%. In contrast, Q3 shows a median return of -0.80%, reinforcing expectations of a potential pullback in the coming months.
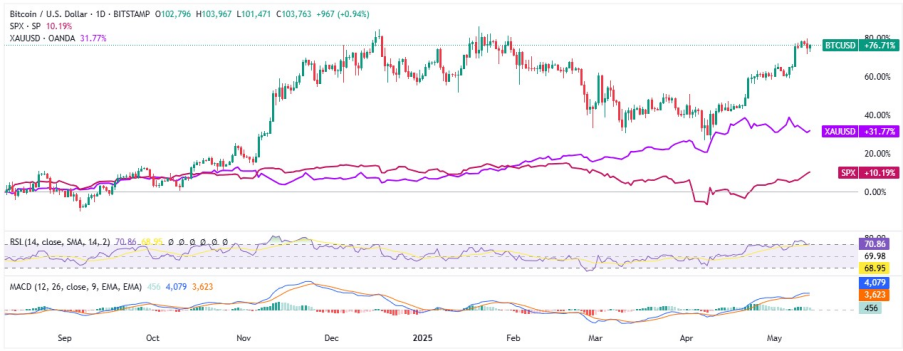
Source:Tradingview
A look at the recent chart shows BTC/USD moving more in sync with the S&P 500, while diverging somewhat from Gold (XAU/USD) spot prices. This growing correlation with equities—amid renewed optimism over a potential US-China trade deal—could support further upside in Bitcoin toward a new all-time high (ATH). However, this trend also raises questions about the prevailing “Digital Gold 2.0” narrative surrounding Bitcoin.
On-chain analysis, exchange flow and position data
Recent blockchain data from Glassnode indicates that ‘whales’—long-term holders and large investors—have been actively accumulating Bitcoin. The accumulation trend score has remained above 1.0 for both wallets holding over 10,000 BTC and entities with 1,000–10,000 BTC, reflecting strong buying interest among major holders.
Supporting this bullish sentiment, exchange flow data reveals a two-year high in outflows from centralized exchanges, suggesting a shift toward holding rather than selling. This pattern typically signals investor confidence and reduced selling pressure.
ETF flows and market sentiment
Meanwhile, data from Coinglass highlights a wave of short liquidations in Ethereum (ETH/USD), which may have contributed to Bitcoin briefly pushing past the $105,000 mark, as broader market dynamics turned in favor of bulls.
Following the approval of Bitcoin ETFs in late 2024, BTC/USD prices received an additional boost from institutional investors. In late April, ETF reports highlighted a significant $591 million net inflow in a single day and $3.3 billion over the course of the week. Notably, BlackRock’s iShares Bitcoin Trust recorded an average of $1 billion in daily purchases by the end of April.
On another note, the Crypto Fear and Greed Index recently showed a “Greed” level, reflecting heightened trader confidence. This sentiment aligns with increased social media chatter and rising Google Trends activity surrounding Bitcoin.
Forecasts from Elites
Top-tier banks, financial institutions, crypto experts, and Wall Street analysts are all increasingly optimistic about Bitcoin’s price rally. However, some caution that short-term volatility may pose risks.
In a Telegram message to CoinDesk, Jeff Mei, COO of crypto exchange BTSE, noted, “Macro concerns are driving the market, and the next Federal Reserve decision and remarks in June will likely play a pivotal role in pushing Bitcoin past its previous all-time high.”
Cathie Wood’s ARK Investment, in its Big Ideas 2025 report, updated its Bitcoin price targets for 2030, with projections of ~$300,000 (bear case), ~$710,000 (base case), and ~$1.5 million (bull case).
Meanwhile, MicroStrategy CEO Michael Saylor is looking at a 21-year horizon, in line with Bitcoin’s fixed supply of 21 million coins, forecasting a price of $13 million per BTC/USD.
Twitter founder and Block CEO Jack Dorsey also has a bold prediction, suggesting Bitcoin could surpass a $20 trillion market cap by 2030.
Bitcoin Price Forecast for 2025, 2026, 2027, 2028, 2029, 2030
| Source | For 2025 | For Long-Term |
| Standard Chartered | $200,000 | $500,000 by 2028 (multi-year path) |
| MicroStrategy CEO Michael Saylor | Short-term not specified | $13 million in next 21 years |
| ARK Invest | Short-term not specified but overall bullish | $710K base case by 2030; $1.5 million bull case; bear case ~$300K |
| Binance | $103,211 | $131,000 |
Key catalysts for Bitcoin
The following are key factors likely to influence Bitcoin prices for the remainder of 2025 and beyond. Industry optimism and technological advancements are among the most influential drivers, garnering significant attention. However, challenges such as a stronger US Dollar, higher interest rates, and ongoing geopolitical uncertainty could pose hurdles for BTC/USD bulls in the near future.
Positives for Bitcoin (BTC/USD)
- Industry optimism around Trump’s election: US President Donald Trump’s pro-Bitcoin stance—and the recent announcement to potentially include BTC in national reserves—has fueled optimism in the crypto space. While the news sparked a classic “buy the rumor, sell the news” reaction, its long-term implications could be bullish.
- Adoption by major countries: Several countries are moving closer to replicating El Salvador and Bhutan’s BTC adoption models. Increased national-level usage could further strengthen Bitcoin’s position as a global asset and support long-term price growth.
- Bitcoin Halving: Bitcoin’s scheduled halving event—last occurring in April 2024—cut BTC issuance in half. Historically, halving cycles have preceded significant price rallies, and this trend may continue as supply tightens.
- Bullish on-chain data: Rising cold storage levels and shrinking exchange-held supplies signal a tightening float. Even modest increases in demand could drive significant price gains under these conditions.
- Technological advancement: The expansion of the Lightning Network, integration of smart contracts, and development of Layer-2 scaling solutions are enhancing Bitcoin’s utility and scalability. Additionally, global trends toward digital payments further support BTC adoption.
Negatives for Bitcoin (BTC/USD)
- Geopolitical tensions: While Trump’s election has been positive for crypto sentiment, it also intensifies global geopolitical uncertainties. Heightened tensions may threaten critical infrastructure and cloud computing dependencies, potentially disrupting the broader Bitcoin environment.
- Rising Competition from Other Cryptocurrencies: Ethereum continues to dominate in technical adoption and utility, posing a strong challenge to Bitcoin’s market share. If the market shifts toward ETH or other emerging platforms, Bitcoin’s demand could soften, affecting long-term bullish forecasts.
- Interest rate hike concerns: Although many central banks are easing away from pandemic-era rate hikes, ongoing global supply chain issues could delay aggressive rate cuts. In such cases, investors may pivot toward traditional safe-haven assets like Gold and the U.S. Dollar, diverting capital away from Bitcoin.
- Regulatory fears: Despite the Trump administration placing pro-crypto figures in key roles—such as SEC Chair Paul Atkins—regulatory clarity remains elusive. Ongoing discussions around stricter Bitcoin oversight could hamper investor sentiment and price momentum.
- Leverage woes: While leverage boosts participation, it also raises systemic risks. If major players (“whales”) unwind positions or trigger liquidations, it could cause sharp price corrections and heighten volatility across the market.
Conclusion
Since mid-2017, Bitcoin has surged from around $2,000 to over $104,000, reflecting a major shift in investor sentiment toward what was once viewed as a highly speculative asset. This transformation has been driven by a combination of factors—including improved market infrastructure, weakening confidence in traditional fiat currencies like the U.S. Dollar, and a growing demand for alternative investment avenues beyond gold, the Japanese yen, and the Swiss franc. Together, these dynamics continue to support the long-term bullish case for Bitcoin, even as short-term volatility remains a given.
Looking ahead, Bitcoin appears poised to challenge its all-time high near $120,000 by the end of 2025, although further upside may require stronger catalysts. On a broader time horizon, the prospect of Bitcoin reaching seven-figure territory, while ambitious, is not beyond consideration given ongoing institutional adoption, fixed supply, and evolving global financial trends.