- Bitcoin(BTC) stuck in tight weekly range, inside key technical envelope.
- BTC trades above strong supports, with upbeat RSI backing the bulls.
- BTC/USD Sellers struggle while buyers eye a breakout above $105K and fresh all-time highs
The BTC/USD pair stays flat around $103,800, stuck in a week-long range during Friday’s European session. However, strong support and a positive Relative Strength Index (RSI) indicator keep buyers optimistic about breaking past key resistance and reaching new all-time highs (ATH).
Technical chart: Daily chart indicates proximity to breakout
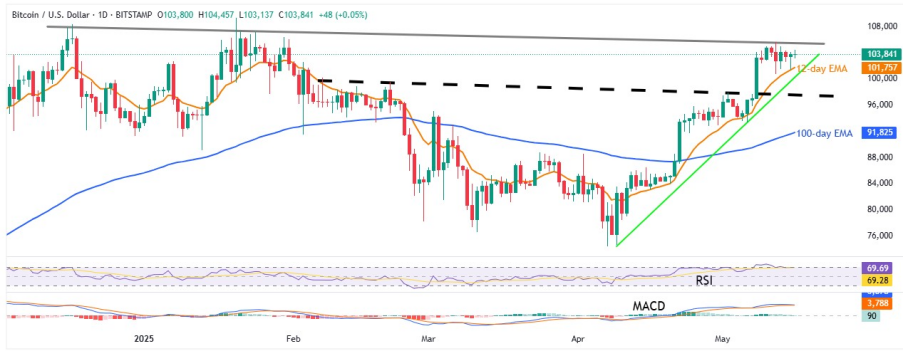
Source:Tradingview
Despite defending the weekly trading range, BTC stays well beyond the key Exponential Moving Averages (EMAs) and a five-week-old ascending support line, not to forget for maintains the previous weekly breakout of a three-month-old resistance, now support.
This joins the upbeat conditions of RSI (14) line, not overbought, to suggest gradual strength in prices to challenge a downward-sloping resistance line from December 2024, close to $105,700.
A breakout could push Bitcoin prices toward the 2024 high near $108,370 and eventually the record $109,360, with $110,000 in sight.
Meanwhile, the 12-day EMA restricts immediate downside of the BTC/USD near $101,750, a break of which will direct sellers toward a five-week-long rising support line close to $100,300 and resistance-turned-support line stretched from February, near $97,800 by the press time.
It should be noted that the BTC/USD weakness past $97,800 makes it vulnerable to slump toward the 100-day EMA support of $91,825 before confirming the bearish trend.
BTC/USD: Four-hour chart
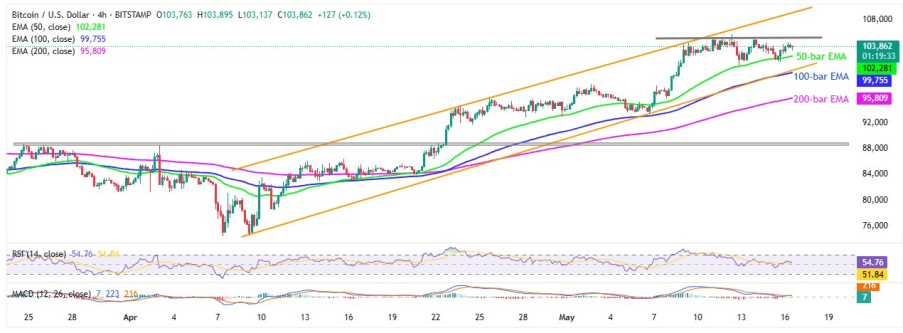
Source:Tradingview
Bitcoin (BTC/USD) faces increasing technical hurdles on the four-hour chart, with the RSI suggesting a continuation of short-term sideways movement.
Key levels to watch are the 50-bar EMA and a one-week horizontal range near $102,280 and $105,000.
As BTC/USD stays above these key indicators and within a month-long bullish channel, a move past $105,000 becomes likely, opening the door to the channel’s upper line around $109,200.
If Bitcoin holds above $109,200, the all-time high near $109,360 and the $110,000 level come into focus.
On the downside, support is strong near $99,750, where the 100-bar EMA and channel bottom converge. A break below this support could lead to the 200-bar EMA at $95,800, and further weakness could target the $88,800-$88,600 range.
Overall, Bitcoin buyers are targeting new all-time highs, but a solid fundamental catalyst is necessary for further upside.