
- PEPE price retreats from January’s high but stays above key resistance, now support, to keep bullish trend intact.
- RSI supports the pullback, but MACD keeps bearish expectations in check.
- PEPE/USD’s consistent trading above important moving averages strengthens bullish outlook.
- Bears need a drop below $0.00001073, while bulls may target the 50% Fibonacci retracement next.
PEPE Price (PEPE/USD) hits intraday low near $0.00001435 heading into Friday’s US session, following a run-up to refresh a four-month high. With this, the PEPE coin snaps two-day winning streak while justifying an overbought Relative Strength Index (RSI) 14 line. Still, unclear signals from the Moving Average Convergence Divergence (MACD) indicator and a strong hold above the key Simple Moving Averages (SMAs) keep PEPE/USD sellers cautious.
Technical chart: Daily chart highlights bull’s retreat
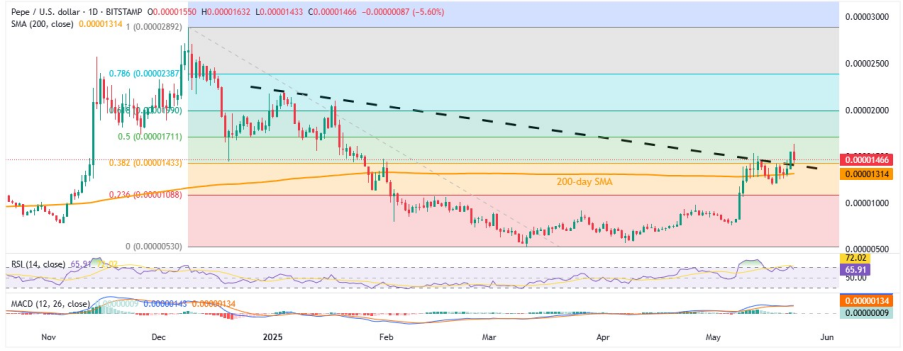
Source:Tradingview
PEPE/USD struggles to maintain its breakout above the downward resistance line from early January near $0.00001400. That said, RSI pulls back from overbought levels and also attracts sellers.
However, mixed MACD signals and support from the 200-day SMA at $0.00001314 challenge further downside of the PEPE/USD pair.
If PEPE continues to drop, the next support levels are around $0.00001200 and $0.00001140, before potentially testing $0.00001000 and April’s peak of $0.00000980.
On the upside, a rebound needs to clear the 50% Fibonacci retracement of its December 2024 to March 2025 fall near $0.00001711. If successful, the PEPE/USD bulls can target the 61.8% Fibonacci level around $0.00001990, then the $0.00002000 mark. The yearly high of $0.00002182 could be the next key test if PEPE breaks past $0.00002000.
PEPE/USD: Four-hour chart appears more bullish
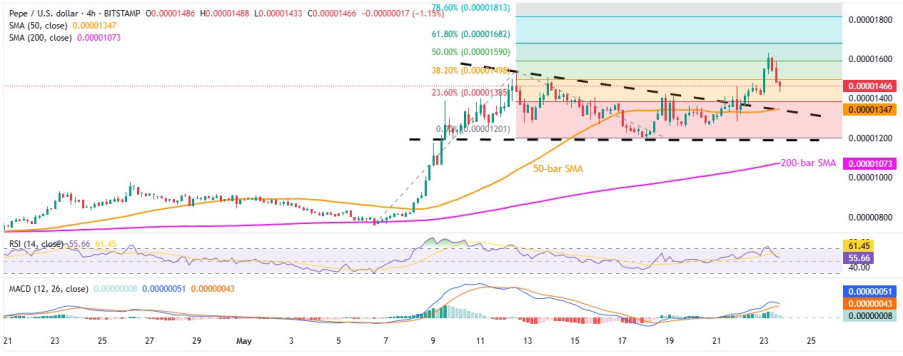
Source:Tradingview
On the four-hour chart, PEPE/USD’s recent retreat doesn’t break the early-week bullish triangle breakout. With positive MACD signals and RSI near 50, the overall bullish trend looks likely to continue, keeping buyers optimistic.
If PEPE sellers break the $0.00001347 support, which includes the triangle’s upper boundary and the 50-bar SMA, the next targets are the triangle’s bottom around $0.00001200 and the 200-bar SMA at $0.00001073.
On the flip side, the 50% and 61.8% Fibonacci Extensions (FE) of the PEPE/USD pair’s May 06-18 moves at $0.00001590 and $0.00001682 will act as key resistance levels for any immediate recovery. If the PEPE bulls push higher, $0.00001711 will be the next major resistance, as shown on the daily chart.