- Uniswap pares the biggest daily jump in six months while easing from multi-week high.
- Breakout above key resistance, bullish SMA crossover, and strong MACD keep UNI buyers hopeful despite overbought RSI.
- Watch for breakout at $9.30 as key hurdle for UNI/USD bulls; downside remains elusive above $7.70.
Uniswap (UNI/USD) falls to $8.20, down over 5% intraday ahead of Wednesday’s U.S. session. The pullback follows UNI’s biggest daily jump since November 2024 and a retreat from its highest level since late February.
That said, overbought 14-day Relative Strength Index (RSI) may be behind the drop, but bullish signals from the Moving Average Convergence and Divergence (MACD) indicator and successful breakout above key resistance—now acting as support—keeps buyers hopeful unless UNI dips back below those levels.
UNI/USD: Daily chart favors buyers
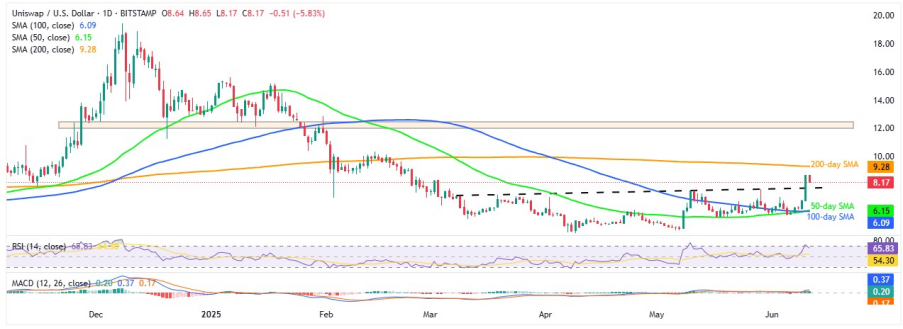
Source: Tradingview
Despite UNI/USD’s recent pullback, the pair holds above the previous day’s breakout of a three-month resistance, now support near $7.70. Also supporting the bullish outlook are positive MACD signals and a “Golden Cross,” with the 50-day Simple Moving Average (SMA) crossing above the 100-day SMA—a classic bullish indicator.
Hence, aside from the $7.70 resistance-turned-support, key UNI support lies near the converging SMAs around $6.15–$6.10, followed by $6.00. A break below these levels could expose the yearly low of $4.55.
On the upside, UNI must clear the 200-day SMA at $9.30 to target the $10.00 psychological resistance level and the mid-February high near $10.35. A sustained move above $10.35 could lead UNI/USD toward a broader resistance zone between $12.00 and $12.50, seen during late 2024 and early 2025.
UNI/USD: Four-hour chart signals limited upside room
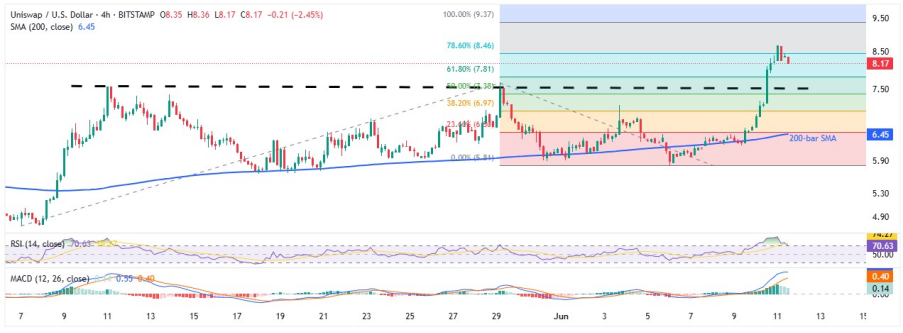
Source: Tradingview
On the four-hour chart, overbought RSI triggered a UNI/USD pullback toward the month-old resistance-turned-support near $7.70.
However, bullish MACD signals limit bearish momentum, making a deeper drop uncertain. If ignored, further downside could test the 200-bar SMA at $6.45—likely the UNI bulls’ last line of defense before attention shifts to daily chart supports.
On the upside, the 100% Fibonacci Extension of the May–June rally near $9.40 acts as immediate resistance, potentially capping gains and redirecting focus to daily levels.
Overall, UNI/USD may stay firm, but limited upside and overbought conditions suggest a short-term pullback is possible.