
- Ethereum price defends week-start recovery while testing key SMA resistance.
- Upbeat RSI, MACD conditions, sustained trading beyond crucial technical supports favor ETH buyers.
- Convergence of multi-month-old resistance line, horizontal area challenge upside.
- Multiple supports stand ready to restrict short-term ETH/USD downside.
Ethereum (ETH/USD) gains over 2.0% intraday, rising to $2,620 ahead of Monday’s U.S. session. In doing so, ETH buyers extend the week-start recovery while testing the 200-day Simple Moving Average (SMA).
Notably, the price’s sustained trading above key technical support levels, combined with positive signals from momentum indicators like the 14-day Relative Strength Index (RSI) and the Moving Average Convergence and Divergence (MACD), suggests that the ETH/USD pair may attempt once again to break an upward-sloping resistance line from February — a barrier it has failed to cross on four occasions over the past three months. Adding complexity to this setup, a five-month-old horizontal resistance zone aligns with the trendline, creating a critical confluence area that could determine ETH’s next move.
ETH/USD: Daily chart portrays battle with important resistance
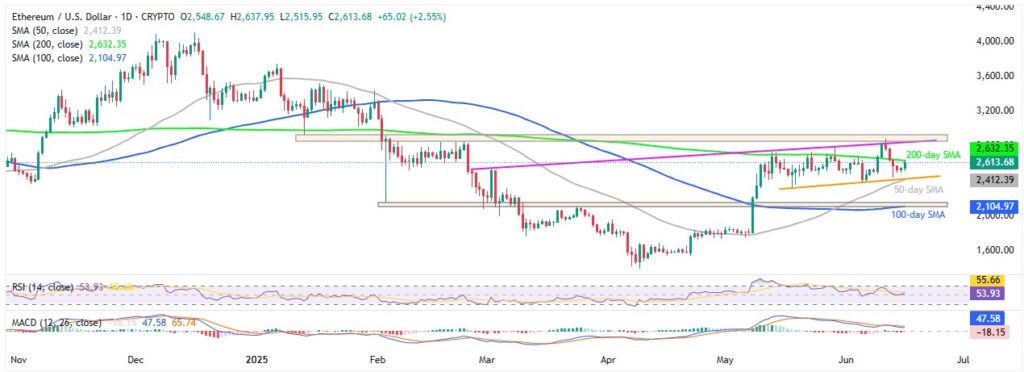
Source: Tradingview
Ethereum challenges the 200-day SMA hurdle at $2,632, supported by a 50.0+ RSI reading and an impending bullish crossover on the MACD indicator — both signaling potential for further upside. However, a strong resistance zone near $2,850–$2,925, formed by the intersection of an ascending trendline from February and a five-month-old horizontal area, remains a critical barrier for ETH/USD bulls.
A successful breakout above that zone would open the door for a rally toward the late January high near $3,440, with the $3,500 psychological level as the next target.
On the downside, immediate support is seen around $2,410, marked by the confluence of the 50-day SMA and an ascending trendline from May 18. Below that, stronger support lies in the $2,150–$2,100 range, where the 100-day SMA aligns with levels established since early February.
ETH/USD: Four-Hour chart hints at fewer challenges for bulls
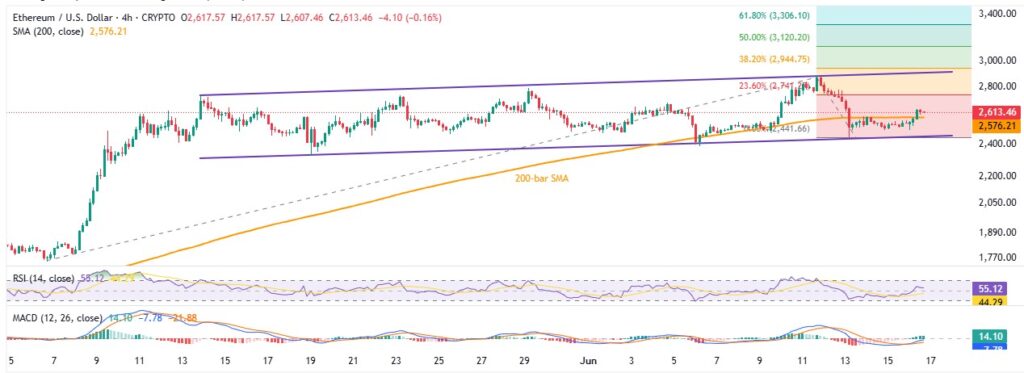
Source: Tradingview
On the four-hour chart, ETH/USD has already broken above the 200-bar SMA, supported by bullish signals from both the RSI and MACD indicators. This momentum suggests further upside potential toward the 23.6% Fibonacci Extension (FE) of the May–June move, located near $2,745.
However, ETH bulls face a major hurdle at the upper boundary of a five-week-old ascending trend channel, currently near $2,905. A decisive break above this level would shift focus to the key resistance zones highlighted on the daily chart — particularly the $2,850–$2,925 region and beyond.
On the flip side, for sellers to regain control, ETH would need to decisively drop below the 200-bar SMA support at $2,576. Such a move could expose the lower boundary of the channel and the recent swing low near $2,440, which would then open the door for a deeper correction toward the daily support levels.
Overall, ETH/USD maintains a bullish bias in the short term, but the upside appears limited unless there’s a clear and sustained breakout above $2,925.