
- Ethereum price drifts lower while holding month-old bullish consolidation pattern.
- Multiple rejections at resistance, along with neutral RSI and bearish MACD, hint at weakening bullish momentum.
- Convergence of 50-day SMA, month-old ascending trendline challenges ETH sellers targeting $2,100.
- 200-day SMA caps near-term gains; $2,925 is the final stronghold for ETH/USD bears.
Ethereum (ETH/USD) price remains under pressure around $2,520, fading the previous day’s corrective bounce, during Thursday’s European session. The pair has been weakening since Monday, ignoring Wednesday’s rebound, when a false breakout above the 200-day Simple Moving Average (SMA) lured in sellers.
Adding to the bearish pressure are neutral signals from the 14-day Relative Strength Index (RSI) and bearish momentum from the Moving Average Convergence Divergence (MACD) indicator.
However, ETH/USD continues to trade within a month-old bullish consolidation pattern. Notably, the convergence of the 50-day Simple Moving Average (SMA) and the lower boundary of this consolidation zone forms a strong support area, posing a significant challenge for sellers looking to regain control.
ETH/USD: Daily chart lures sellers
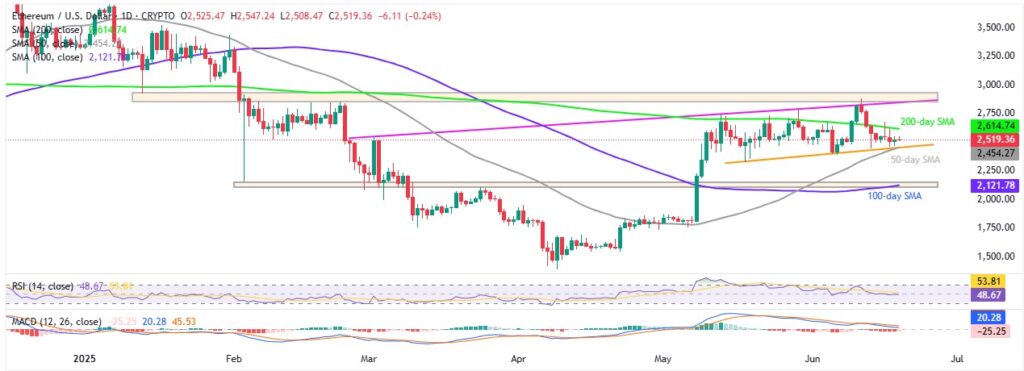
Source: Tradingview
Ethereum’s repeated failures to break above an upward-sloping trendline from late February, along with a five-month-old horizontal resistance zone, continue to weigh on bullish momentum.
These hurdles align with neutral RSI conditions near 50.00 and bearish MACD signals, luring sellers into action. Also adding to the bearish tone is ETH/USD’s recent retreat from the 200-day SMA.
On the downside, a critical support area emerges near $2,450, where the 50-day SMA converges with the bottom of a month-old bullish consolidation pattern. This zone must be decisively broken for ETH bears to regain control.
A confirmed break below $2,450 could expose a broader support region between $2,100 and $2,150 — an area that includes the 100-day SMA and key levels marked since February. If ETH/USD remains weak below $2,100, further declines toward the psychological $2,000 mark and potentially the late-April swing high around $1,900 become increasingly likely.
Alternatively, on the upside, the 200-day SMA near $2,615 acts as immediate resistance. A sustained break above this level would bring attention back to the multi-month descending trendline and horizontal resistance area near $2,855–$2,925.
Should ETH/USD rally beyond $2,925, a move toward the $3,000 psychological level — and possibly higher — cannot be ruled out.
ETH/USD: Four-Hour chart signals trading range
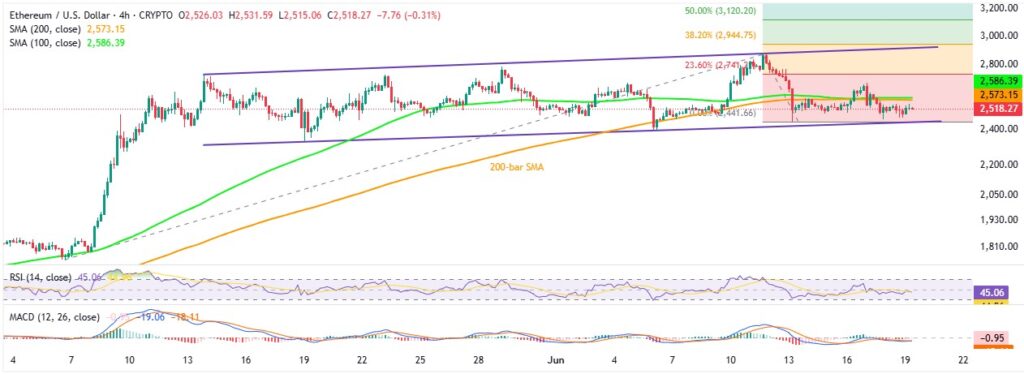
Source: Tradingview
While the daily chart reflects growing bearish pressure on Ethereum (ETH/USD), the four-hour chart presents a more balanced view, hinting at a continuation of the short-term uptrend within a month-old bullish trend channel, currently ranging between $2,440 and $2,920.
Notably, the 200-bar and 100-bar SMAs, hovering around $2,575 and $2,587 at the time of writing, serve as immediate resistance levels. Above that, the 38.2%, 50.0%, and 61.8% Fibonacci Extension (FE) levels of ETH/USD’s May–June rally — located near $2,742, $2,945, and $3,120, respectively — present additional upside hurdles for ETH buyers to overcome.
On the downside, early-May swing highs near $1,880 serve as important support if ETH/USD weakens below $1,900, as outlined in the daily chart analysis.
Overall, while ETH/USD shows signs of losing upside momentum, bearish confirmation will require a decisive break below the $2,440 support zone.