
- Ethereum price rebounds from six-week low, snapping four-day losing streak.
- Oversold RSI sparks ETH recovery from 100-day SMA and key February zone.
- ETH/USD faces pressure as 50-day SMA, immediate falling trendline converge amid bearish MACD signals.
Ethereum (ETH/USD) stays mildly bid near $2,245 during Monday’s European session, recovering from a six-week low and snapping a four-day losing streak by the press time.
That said, the ETH rebound is supported by nearly oversold conditions of the 14-day Relative Strength Index (RSI) and a key support confluence — where the 100-day Simple Moving Average (SMA) aligns with an area marked by levels from early February.
However, the ETH/USD upside remains challenged by bearish signals from the Moving Average Convergence Divergence (MACD) indicator and continued pressure below a resistance confluence formed by the 50-day SMA and a short-term descending trendline.
ETH/USD: Daily Chart Signals Gradual Recovery
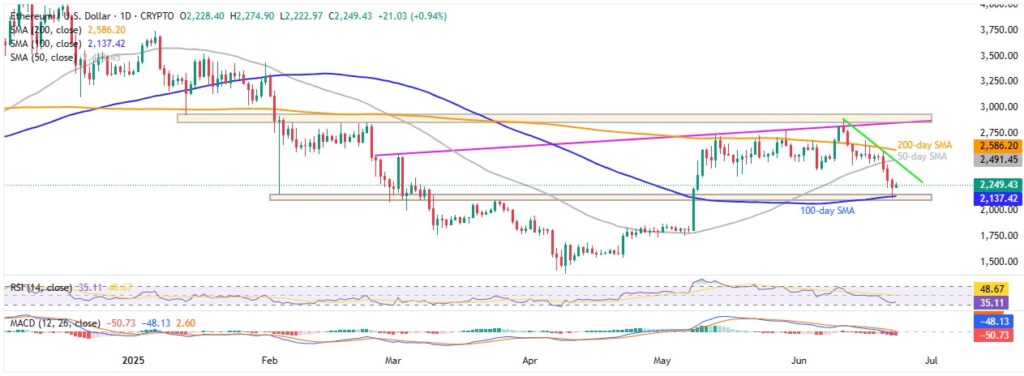
Source: Tradingview
Although ETH remains above the key $2,491 resistance confluence—comprising the 50-day SMA and a descending trendline from June 11—it continues to trade below the 200-day SMA near $2,586 at the time of writing. This, combined with weak momentum indicators, weighs on buyer confidence.
Even if the ETH/USD pair crosses the $2,491 and $2,586 hurdles, an upward trendline from late February and a five-month horizontal resistance near $2,850 will be the decisive catalyst for bulls to retake control.
On the downside, a convergence of the 100-day SMA and levels from early February, around $2,140–$2,150, limits short-term Ethereum losses.
Beyond that, the $2,100 and $2,000 round numbers could challenge the ETH bears before testing early May’s swing high near $1,880 and March’s bottom around $1,755.
ETH/USD: Four-Hour Chart Favors Corrective Bounce
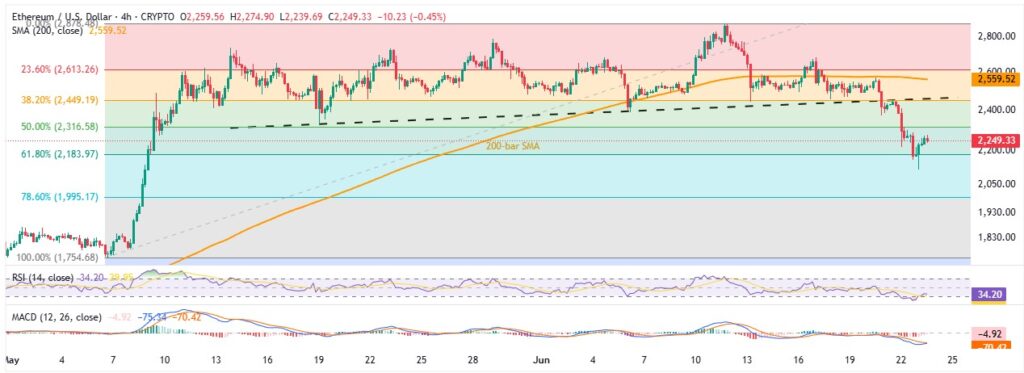
Source: Tradingview
Whether it’s the RSI line recovering from oversold territory, the impending bullish cross on the MACD indicator, or the ETH/USD pair’s strong rebound from the 61.8% Fibonacci retracement of the May-June move—also known as the “Golden Ratio”—Ethereum has all the key catalysts to sustain its rebound for now.
However, ETH bulls need to clear key hurdles—a five-week-old support-turned-resistance near $2,465 and the 200-bar SMA around $2,560—to regain control.
On the downside, a break below the “Golden Fibonacci Ratio” near $2,183 could push prices toward the 78.6% Fibonacci retracement level at $1,995, before testing other support levels highlighted on the daily chart.
Overall, the Ethereum rebound is likely to hold for now, but bears remain in control unless prices clearly break above $2,850.