- Uniswap defends recovery from 100-day EMA, five-week support line but “bear cross” challenges buyers.
- RSI and MACD hint at more upside, but UNI faces strong resistance ahead.
- Upside break of $7.23 opens door for UNI/USD rally toward monthly high.
Uniswap (UNI/USD) remains over 1.0% higher intraday, even after easing from recent highs, and trades mildly bid near $6.93 ahead of Tuesday’s U.S. session. The pair continues to defend Monday’s rebound, supported by the 100-day Simple Moving Average (SMA) and a five-week-old trendline.
Cautious optimism in the broader market—helped by the Israel-Iran ceasefire—adds to the bullish tone, reinforced by positive signals from the 14-day Relative Strength Index (RSI) and Moving Average Convergence Divergence (MACD). However, a bearish crossover on the four-hour chart’s moving averages is starting to challenge the strength of the current recovery.
UNI/USD: Four-Hour chart challenges bulls
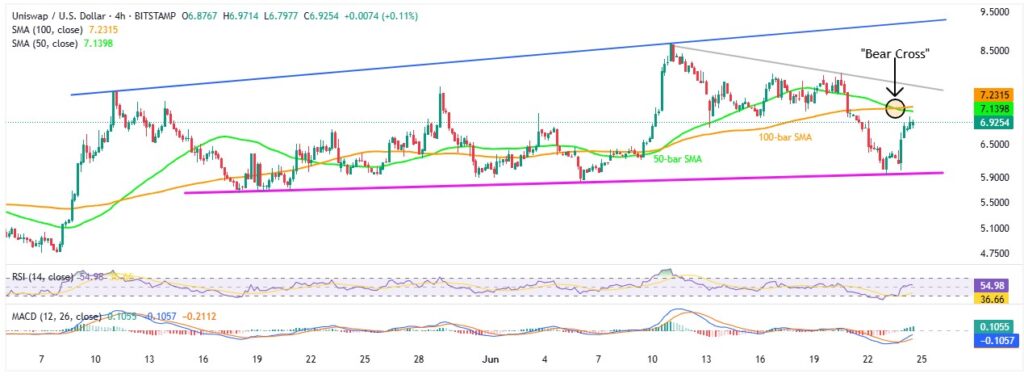
Source: Tradingview
Uniswap (UNI/USD) faces pressure from a “Bear Cross” on the four-hour chart, as the 50-bar SMA remains below the 100-bar SMA. Bulls will need a clear break above the $7.23 resistance—aligned with the 100-bar SMA—to regain control.
If successful, the next challenge lies at a two-week-old descending trendline near $7.68. A breakout there could open the path toward the monthly high around $8.68, followed by a rising resistance line from early May, now near $9.20.
On the downside, UNI/USD continues to hold above a key ascending trendline from May 18, near the $6.00 level. A break below this support would shift focus to deeper levels on the daily chart.
Despite the bearish crossover, both the RSI and MACD hint at continued bullish momentum, keeping recovery hopes alive—for now.
UNI/USD: Daily chart points to upside room
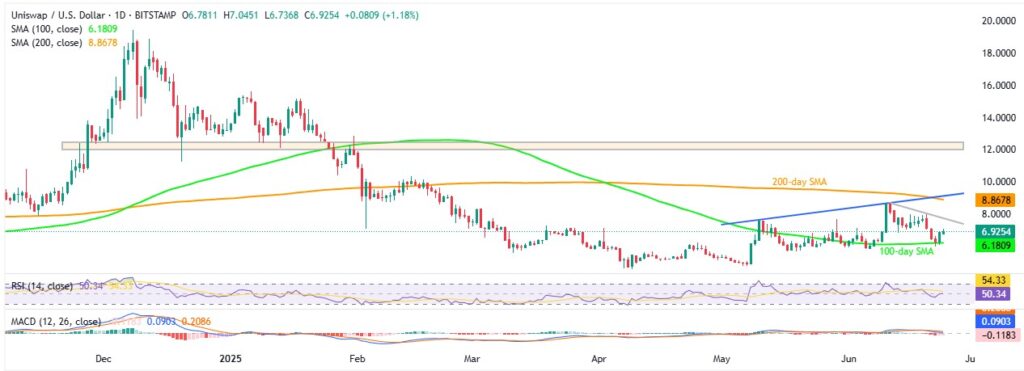
Source: Tradingview
Unlike the four-hour chart, UNI/USD has more room to move higher on the daily chart, defending the previous day’s rebound from the 100-day SMA. This support is strengthened by a neutral RSI and weakening bearish signals from the MACD.
However, immediate upside is capped by a two-week-old resistance line near $7.68, followed by the 200-day SMA at $8.87 and a five-week-old ascending trendline around $9.20.
A clear break above $9.20 could push UNI/USD toward the $10.00 psychological level and the mid-February swing high near $10.34, before facing a broad resistance zone between $12.10 and $12.40 that has held since November 2024.
On the downside, UNI bears would need a daily close below the 100-day SMA at $6.18 to regain control. Even then, the five-week-old ascending trendline near $6.00 will serve as the last line of defense before prices could slip toward May and April lows around $4.75 and $4.55.
In summary, Uniswap is likely to see a short-term recovery, but buyers should stay cautious until prices clearly break above $7.23.