- Crypto markets cheer Israel-Iran ceasefire and industry tailwinds, eyeing weekly gains.
- Ethereum, Uniswap & Ripple light up watchlists with interesting technical & fundamental catalysts.
- ETH, UNI & XRP build recovery momentum as market looks to Fed data, risk sentiment & crypto news.
The cryptocurrency market is showing renewed risk appetite following the Israel-Iran ceasefire, with a bullish boost also coming from Donald Trump Administration’s push to count crypto as Federal mortgage asset, early Thursday. On top of that, fresh, coin-specific developments around Ethereum (ETH), Uniswap (UNI), and Ripple (XRP) are helping top-tier cryptos recover from last week’s losses.
Adding fuel to the fire, technical setups across these tokens have turned increasingly attractive—making ETH, UNI, and XRP ones to watch as both fundamentals and charts align in their favor.
Ethereum (ETH/USD) Soars 11%, Pierces Key Resistance on Growing Market Fame
Ethereum (ETH/USD) has jumped more than 11% this week, reversing its previous losses and trading around $2,478 with a 2.6% intraday gain by the press time. The rally is fueled by improving market sentiment, institutional interest, and a key technical breakout.
Traders are encouraged by Ethereum’s decisive move above the $2,470 resistance zone, which combined the 200-day Exponential Moving Average (EMA) and a former support-turned-resistance line—an area that had capped upside for days.
Adding to the momentum, Bitcoin miner Bit Digital announced a strategic pivot toward Ethereum staking and treasury holdings, signaling rising institutional confidence in ETH. Meanwhile, SharpLink Gaming, the largest publicly traded holder of Ethereum, revealed it added 12,207 ETH between June 16 and 20, bringing its total holdings to 188,478 ETH. The additional investment was worth around $30.67 million at an average price of $2,513 per ETH, per the official report.
It should be noted, however, that the latest increase in Ethereum’s exchange reserves signal low demand and a modest increase in the sell-side pressure.
ETH/USD: Daily Chart Signals Further Upside
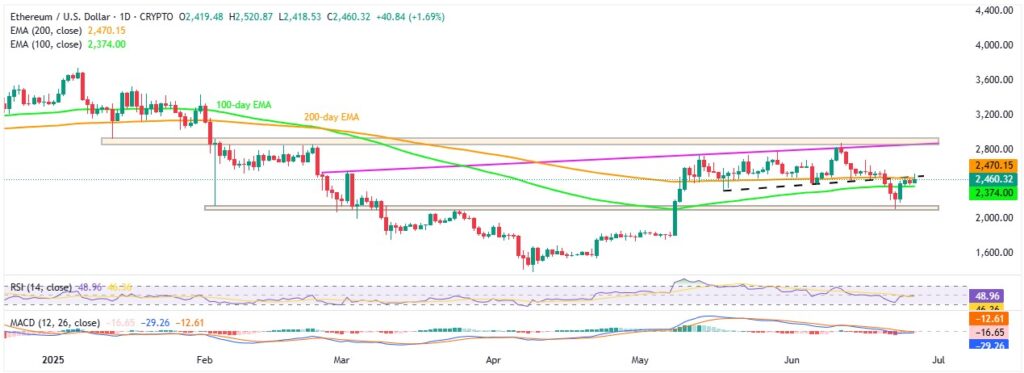
Source: Tradingview
Ethereum (ETH/USD) confirms Monday’s clear break above the 100-day EMA, supported by a steady rise in the 14-day Relative Strength Index (RSI) and an upcoming bullish crossover on the Moving Average Convergence Divergence (MACD) indicator. This momentum helped ETH challenge the key $2,470 resistance zone, which includes the 200-day EMA and a previous support line from May 18.
A daily close above $2,470 would open the path for buyers to push past the $2,500 mark and aim for the mid-month swing high near $2,680. However, Ethereum bulls will face strong resistance around $2,865 to $2,870, where a four-month-old ascending resistance line meets horizontal levels marked since February—making this a tough barrier before attempting to reverse the downtrend from early 2025.
On the downside, sellers need a break below the 100-day EMA support at $2,374 to regain control. Still, a horizontal support zone between $2,115 and $2,155, in place for over four months, could limit any further declines.
With solid fundamentals and fresh technical signals, Ethereum is drawing traders back in—this rally might just be getting started.
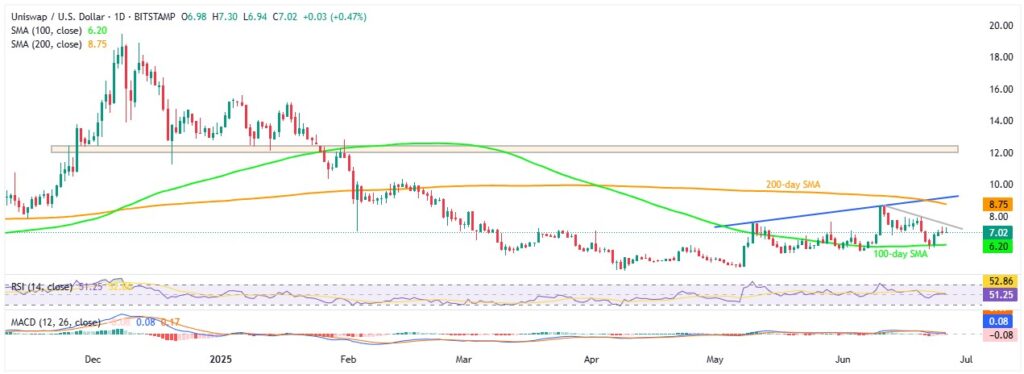
Uniswap (UNI/USD) cheers rising volume with 15% weekly jump
Uniswap (UNI/USD) rises 2.70% intraday to $7.17, clocking a 15% weekly gain as it approaches a two-week-old descending resistance line. The move follows a 40% surge in Uniswap’s decentralized exchange (DEX) trading volume—from $18 billion in late May to $21 billion last week.
Sentiment is further boosted by Anchorage Digital’s integration of the Uniswap Trading Application Programming Interface (API), allowing institutional users—including liquid funds, asset managers, protocol foundations, and treasuries—to access Uniswap Protocol and UniswapX liquidity directly via a web dashboard.
Additional support comes from Unichain’s upgrade, now enabling deployment and transfer of ERC-20 tokens at much lower cost than through the Ethereum Virtual Machine (EVM).
UNI/USD: Daily Chart Points To Limited Northside Room
Source: Tradingview
Uniswap (UNI/USD) extends its early-week rebound from the 100-day Simple Moving Average (SMA), supported by improving RSI conditions and fading bearish signals on the MACD indicator.
However, a two-week-old descending resistance line near $7.50 could cap further upside unless fresh, positive industry news boosts sentiment. A break above that would expose the 200-day SMA at $8.80 and a rising trendline from early May around $9.30—key zones where sellers may regroup before UNI attempts to challenge the seven-month horizontal resistance between $12.10 and $12.40.
On the flip side, strong support lies at the 100-day SMA around $6.20. Below that, levels at $5.80, $4.75 (May low), and $4.55 (yearly low from April) may come into play.
Overall, Uniswap’s fundamentals remain fragile, despite the latest upbeat news, making immediate resistance levels crucial for UNI bulls to maintain momentum.
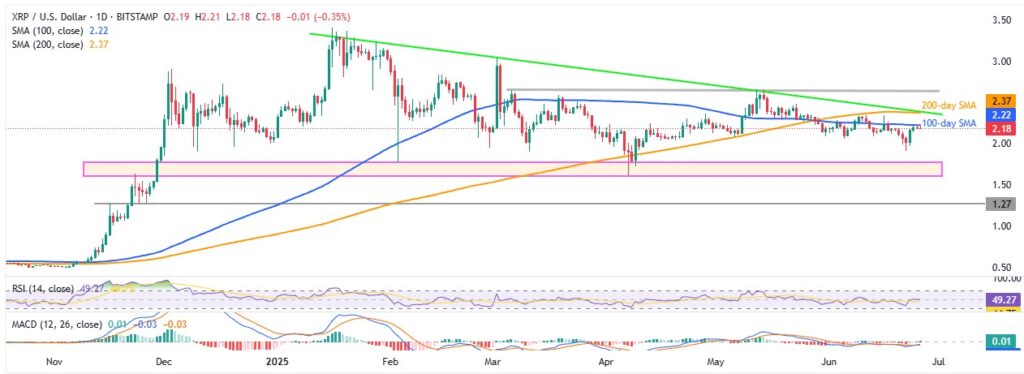
Ripple Snaps Two-Week Losing Streak On Multiple Positives
Ripple (XRP/USD) is set for its first weekly gain in three, but struggles to clear the 100-day Simple Moving Average (SMA) near $2.20. Despite multiple bullish catalysts, technical confirmation is still lacking.
Early 2025 announcements from the Trump administration hinting at XRP’s inclusion in reserve currency and optimism over Ripple’s legal battle with the U.S. Securities and Exchange Commission (SEC) initially pushed prices higher. However, rising geopolitical tensions and shifting trader focus toward Bitcoin (BTC/USD) and Ethereum (ETH/USD) have capped gains.
RippleX released XRP Ledger version 2.5.0, and the launch of five new stablecoins on the XRP Ledger at the Apex 2025. Institutional interest also remains firm, especially after the debut of XRP spot Exchange Traded Funds (ETFs) in Canada. Furthermore, Ripple’s new Permissioned Decentralized Exchange (DEX) went live, offering expanded utility for investors.
XRP/USD: Bulls Struggle On Daily Chart
Source: Tradingview
The 100-day SMA has been restricting the XRP/USD upside in the last three consecutive days and the same joins steady RSI line to suggest waning bullish momentum.
However, upbeat fundamentals and the bullish MACD signals keep Ripple buyers hopeful of overcoming the immediate SMA hurdle of $2.22, which in turn will allow buyers to aim for a converngence of the 200-day SMA and a five-month resistance line, close to $2.37-40.
In a case where the Ripple price remains firmer past $2.40, a horizontal area comprising levels marked since early March, near $2.65-70, will be the last defense of the bears.
Alternatively, XRP pullback could aim for the $2.00 threshold before the latest bottom surrounding $1.91. However, a seven-month-old broad horizontal area between $1.60 and $1.78, will be a tough nut to crack for the XRP/USD bears before retaking control.
Overall, Ripple buyers are flexing muscles and have some ingredients for a successful recipe but they need cooking time.
Conclusion
While the broader crypto market signals further upside, Uniswap and Ethereum appear better positioned for additional gains than Ripple, backed by stronger fundamentals and bullish technical setups. Ethereum benefits from renewed institutional interest and key resistance breakouts, while Uniswap rides rising decentralized exchange (DEX) volumes and growing adoption.
Looking ahead, traders will closely watch the US Core Personal Consumption Expenditures (PCE) Price Index—the Federal Reserve’s preferred inflation metric—for policy clues. Geopolitical developments in the Middle East, Donald Trump’s push for a new Fed Chair nominee, and fresh industry headlines will also play a key role in shaping near-term crypto market direction.