- History repeats as crypto markets rebound, transforming mild optimism into meaningful gains.
- Major cryptocurrencies gain between 6% and 9% with BTC & ETH straying in between.
- Mixed signals for ETH as funding rates dip despite golden cross; BTC data hints at deepening retail-whale divide.
- Central bankers and NFP numbers will headline this week’s calendars, with risk catalysts setting the pace for what’s next.
Crypto markets showcased classic smart money behavior last week, not only reversing previous losses but posting fresh gains—even as retail traders hesitated amid unresolved geopolitical tensions. That said, Bitcoin (BTC) gained over 6.0% to $107K while Ethereum (ETH) and Ripple (XRP) rose nearly 9.0% each, respectively to $2,425 & $2.20 by the press time of Saturday.
The Iran-Israel ceasefire and U.S. involvement haven’t ended the conflict, but they’ve cooled tensions — and that’s been enough to steady crypto markets. Just like in past crises, fear sparked quick sell-offs, but smart money bought the dip while retail traders hesitated. With stocks rising and fading inflation fears, crypto is finding solid ground. Hints of a more dovish Fed are also fueling the recovery.
In the crypto space, industry-specific developments added fuel to the momentum. Japan’s new wave of crypto reforms grabbed attention, as did Judge Torres’ decision to block a mutual $50 million settlement between Ripple and the U.S. SEC—rekindling regulatory uncertainty.
Meanwhile, Mastercard made headlines by partnering with Chainlink to build a cross-chain crypto bridge, signaling growing institutional interest in blockchain infrastructure. In the U.S., the Senate unveiled a bold proposal to limit the SEC’s authority and reshape crypto regulation, while discussions around the GENIUS Act gained traction.
Adding to the buzz, Texas announced a historic Bitcoin Reserve Bill, and the White House sparked conversation with its proposal to explore crypto as a legitimate method for mortgage payments—a potential game-changer for mainstream adoption.
Looking ahead, Tuesday’s US ISM PMI for June and a speech from Fed Chair Jerome Powell will set the tone before Friday’s closely watched Nonfarm Payrolls (NFP) report. While these economic indicators will shape market expectations, the real spotlight may fall elsewhere—on escalating Middle East tensions, fresh US crypto reform developments, and potential trade deal headlines. Together, these risk drivers could heavily influence sentiment across both traditional and digital markets. Let’s take a closer look at the big names in crypto and the key trends shaping their momentum.
Bitcoin Highlights Retail vs. Whale Battle As Bulls Flex Muscles
Bitcoin’s over 6.0% weekly run-up, around $107,400 by the press time, traced the S&P 500 Index, as well as support gained from the institutional investors.
That said, the following chart from Santiment clearly shows a clear divide among the retail traders and whales, as far as the BTC’s supply distribution by balance of addresses is concerned.

Source: Santiment
Moving on, an additional chart from the TradingView shows a clearly linear correlation between the Bitcoin (BTCUSD) and S&P 500 Index (SPX), while also showing the gold’s separate path.

Source: TradingView
Elsewhere, the sosovalue data portrays the institutional investors’ rush toward the Bitcoin (BTC) as the spot US BTC ETF inflows jumped to the highest level in five weeks, up for the third consecutive week, while posting the $2.2 billion inflow figure for the week ended on June 27.
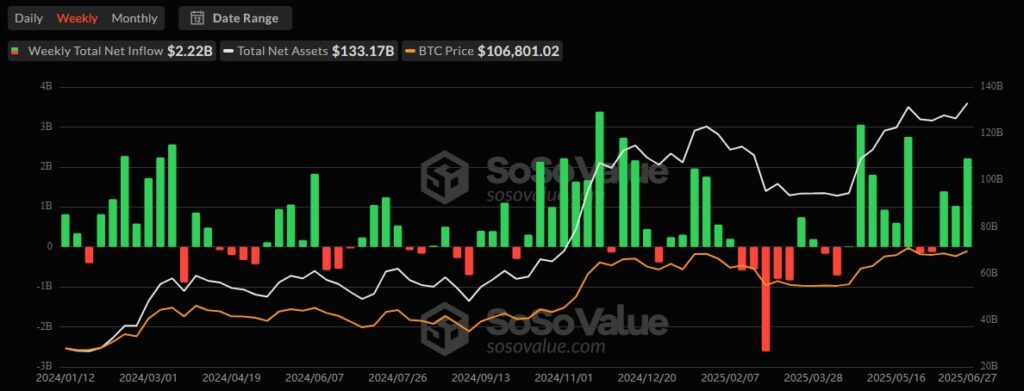
Source: SoSoValue
Bitcoin enters the new week with growing optimism, supported by improving market sentiment, institutional confidence, and active whale accumulation. While the bulls appear to have the upper hand, technical barriers remain in place—making it a test of strength, patience, and timing for traders eyeing the next leg higher.
BTC/USD: Daily chart highlights key upside barriers
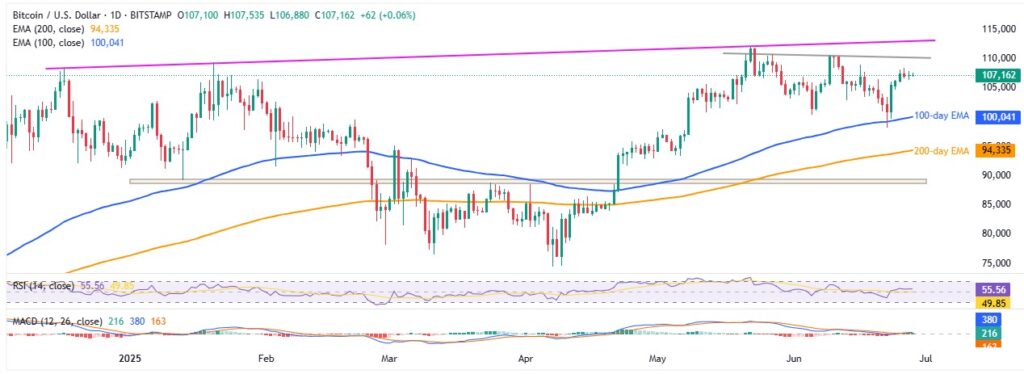
Source: TradingView
Bitcoin is holding steady above its 100-day Exponential Moving Average (EMA) near $100,050, backed by positive signals from the 14-day Relative Strength Index (RSI) and the Moving Average Convergence Divergence (MACD) indicator. This builds a strong bullish outlook.
However, the bulls face tough resistance around $110,000 to $113,000—a level that has held for five weeks and could block further gains. If Bitcoin breaks above this, the next targets are $120,000 and the much-discussed $125,000.
On the downside, a drop below the 100-day EMA support at $100,500 could push Bitcoin down to the 200-day EMA near $94,330. If that level fails to hold, a strong horizontal support zone between $89,100 and $88,700 could provide a final line of defense for the bears.
Traders should watch these key levels closely—Bitcoin’s next move could trigger significant market shifts.
Ethereum Highlights Funding Rates and “Golden Cross”
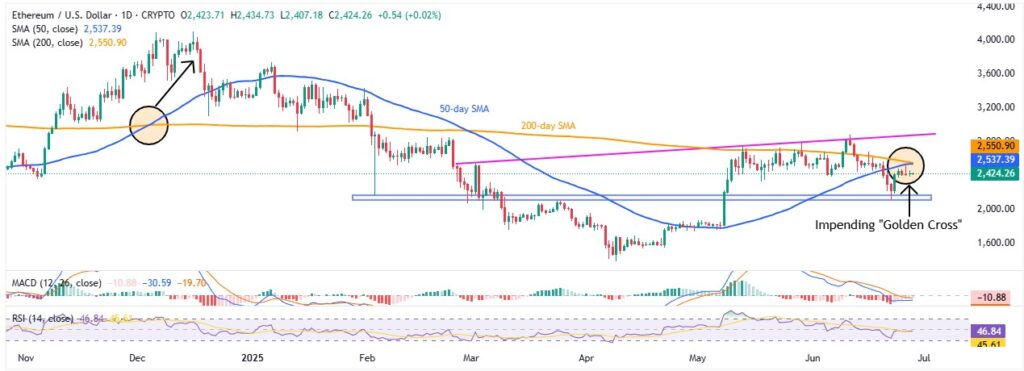
Ethereum (ETH/USD) posts a little slow institutional demand versus the Bitcoin (BTCUSD), as well as highlight the heaviest slump in the funding rates since September 2023. However, a classic bullish moving average crossover “Golden Cross” where the 50-day Simple Moving Average (SMA) pierces the 200-day SMA from below and raise optimism about the bullish move.
The following chart shows a seventh consecutive weekly inflow into the US Spot ETH ETFs, to $283.41 million at the latest, per the SoSoValue data.
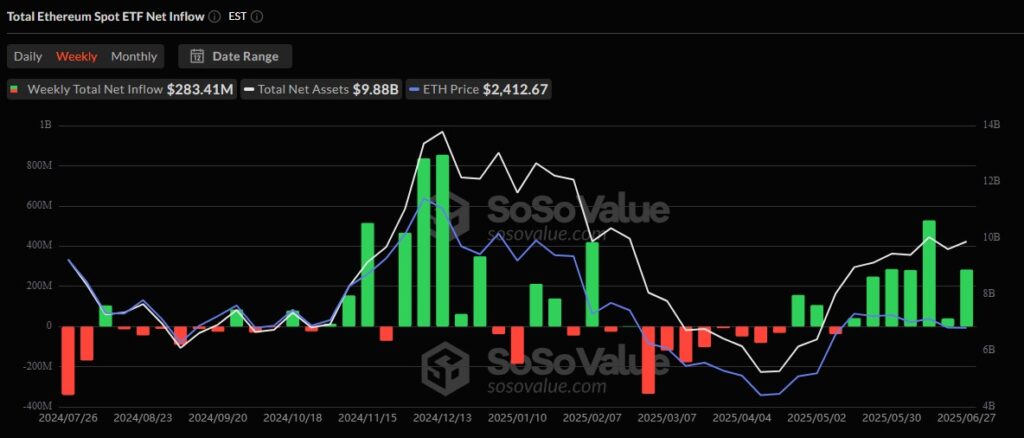
Source: SoSoValue
Meanwhile, the ETH Total Funding Rates Aggregated by Asset (Ethereum in this case) marked the sharpest weekly slump since September 2023. This suggests a significant number of traders are shorting the asset in the futures market, requiring a cautious view from the bulls.

Source: Santiment
It’s worth noting, however, that the daily chart of the Ethereum (ETH/USD) teases a “Golden Cross” bullish moving average crossover that paid around 17% gains when last witnessed during December 2024.
ETH/USD: Daily chart points To bullish bias
Source: TradingView
Ethereum (ETH/USD) has bounced back from its five-month support zone between $2,150 and $2,115. However, it’s now facing stiff resistance near $2,537–$2,551, where the 50-day and 200-day Simple Moving Averages (SMA) are converging.
Momentum indicators offer cautious optimism—the 14-day Relative Strength Index (RSI) is near the neutral 50.00 level, and the Moving Average Convergence Divergence (MACD) is slowly leaning bullish. This hints at a gradual move higher.
If ETH breaks above $2,551, the path opens toward $2,985—around a 17% potential gain, based on levels from late 2024. Still, it must first clear resistance near $2,895 and the key $2,900 mark, shaped by a rising trendline from February.
On the downside, strong support around $2,115 has held so far. A break below could drag ETH toward $2,000, with further weakness targeting $1,890 and then $1,700.
In short, Ethereum has room to climb, but needs a solid push—possibly from improved fundamentals or renewed institutional buying—to fully confirm a bullish breakout and the anticipated “Golden Cross.”
Ripple fails to deliver as fundamentals outpace price action
Ripple (XRP/USD) broke its two-week losing streak with an 8.8% weekly gain, rising to around $2.20. Still, the price remains trapped between the 100-day and 200-day Exponential Moving Averages (EMA), keeping a lid on bullish momentum.
Adding to the uncertainty, Judge Analisa Torres rejected a mutual $50 million settlement proposal between Ripple and the U.S. Securities and Exchange Commission (SEC), leaving the legal battle unresolved.
On a brighter note, Ripple’s growing daily on-chain transaction volume in profit, along with progress in its Permissioned Decentralized Exchanges (DEX), is giving buyers a reason to stay optimistic.
However, whale activity tells another story. The number of large transactions dropped to 2,651 for the week, suggesting a pause in institutional interest. Yet, the ratio of daily on-chain transaction volume in profit vs. loss rose from 1.13 to 1.38—indicating that while big players may be cooling off, profit-taking by active traders is on the rise.
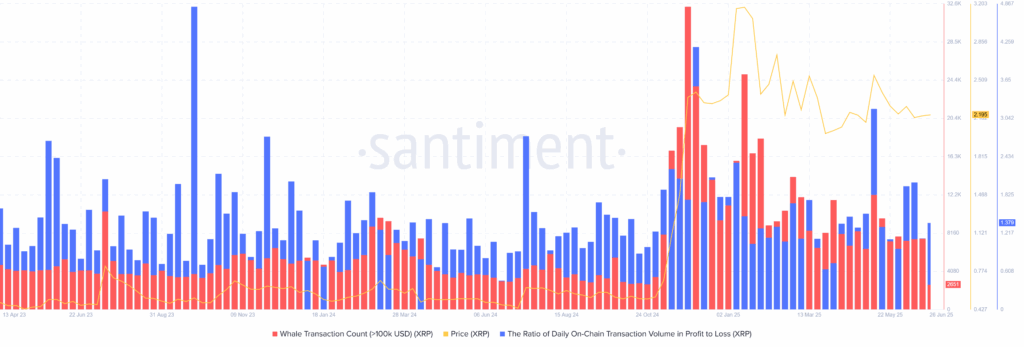
Source: Santiment
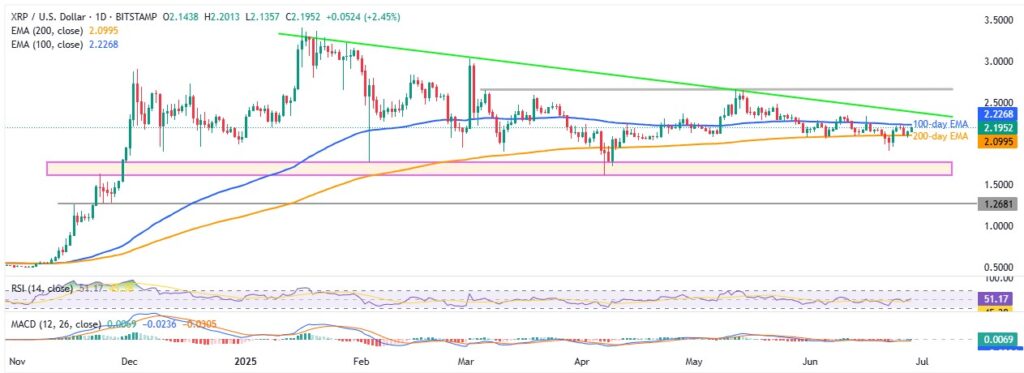
If we look at the technical analysis, the XRP/USD pair gathers bullish momentum while approaching a downward-sloping resistance line from mid-January, close to $2.40 by the press time. However, a clear break of the 100-day EMA hurdle of $2.23 becomes necessary for the bulls to keep control.
XRP/USD: Daily chart points to gradual advances
Source: TradingView
Ripple (XRP/USD) continues to climb after bouncing from the 200-day Exponential Moving Average (EMA) near $2.10, now heading toward the 100-day EMA resistance at $2.23. A breakout above this level would turn attention to a multi-month resistance line around $2.40.
If XRP manages a daily close above $2.40, the next major challenge lies at the $2.65 zone—marked by repeated highs since March. A clear move beyond that could open the door toward early 2025 highs near $3.40, with $3.00 acting as a key checkpoint.
On the downside, a daily close below the 200-day EMA risks pulling the price down to the monthly low of $1.91, followed by a strong support zone between $1.77 and $1.61—levels not seen for seven months.
Despite recent gains, XRP still lacks strong bullish momentum. The 14-day Relative Strength Index (RSI) remains flat near 50.00, and the Moving Average Convergence Divergence (MACD) continues to show weak signals—highlighting that price action has yet to catch up with positive fundamentals.
Conclusion
Last week, crypto markets followed a familiar pattern—retail fear sparked early sell-offs, but smart money stepped in, driving a sharp recovery in Bitcoin, Ethereum, and Ripple. Bitcoin led with a solid 6% gain, supported by institutional confidence. Ethereum showed cautious strength, while Ripple rebounded despite legal setbacks and sluggish momentum.
Looking ahead, attention turns to Tuesday’s U.S. ISM PMI, Fed Chair Jerome Powell’s speech, and Friday’s Nonfarm Payrolls (NFP) data—all of which could influence broader market sentiment. However, the real market movers may come from outside the economic calendar: Middle East tensions, U.S. crypto reform announcements, and trade deal developments. These cross-market risk catalysts could play a major role in shaping the next big move—not just for traditional markets, but for crypto too.