
- Chainlink hits two-week high after bullish breakout from eight-month triangle pattern.
- LINK faces immediate resistance from 100-day SMA and bearish megaphone structure.
- Bullish breakout and strong oscillators support LINK/USD, but recovering 30% YoY loss remains a challenge.
Chainlink (LINK/USD) jumps 2.70% to $13.95 in Thursday’s U.S. session, marking a two-week high after breaking out of an eight-month triangle pattern. The move is backed by a strong 14-day Relative Strength Index (RSI) and bullish Moving Average Convergence Divergence (MACD), boosting buyer sentiment.
Still, immediate upside is capped by the 100-day Simple Moving Average (SMA) and the top of a two-month “Bearish Megaphone” pattern, making it difficult for bulls to fully erase LINK’s 30% year-to-date loss.
LINK/USD: Daily chart signals further upside
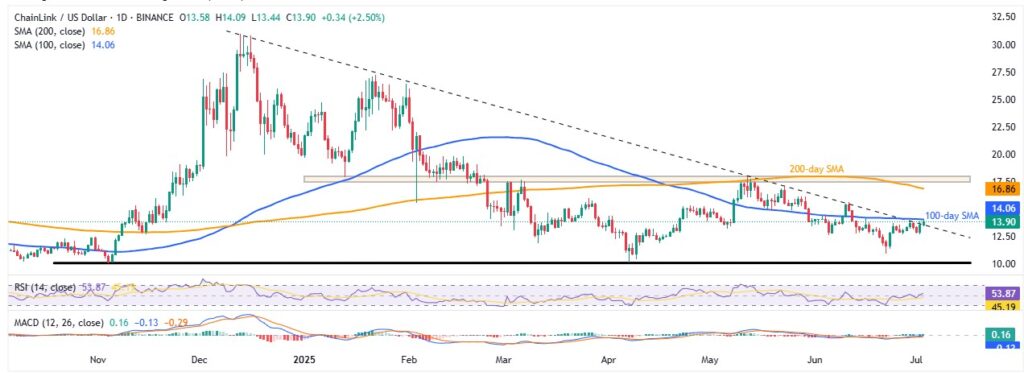
Source: TradingView
Although the 100-day SMA near $14.06 caps LINK’s immediate gains, the breakout from a multi-month triangle, supported by a bullish MACD and a 14-day RSI above the 50.00 neutral mark, signals potential for further upside.
Next targets include June’s peak at $15.66 and the 200-day SMA at $16.86. However, a strong resistance zone between $17.45 and $17.88—active since early January—could pose a major challenge. A successful break above that range may open the door toward the $20.00 psychological level and the yearly high of $27.21.
On the flip side, a daily close below $13.50 would invalidate the triangle breakout, exposing LINK to support at $12.70 and then June’s low at $10.96. If bears maintain control below that, attention will shift to the triangle’s lower boundary near $10.10, followed by the key $10.00 psychological level.
LINK/USD: Four-Hour chart challenges buyers
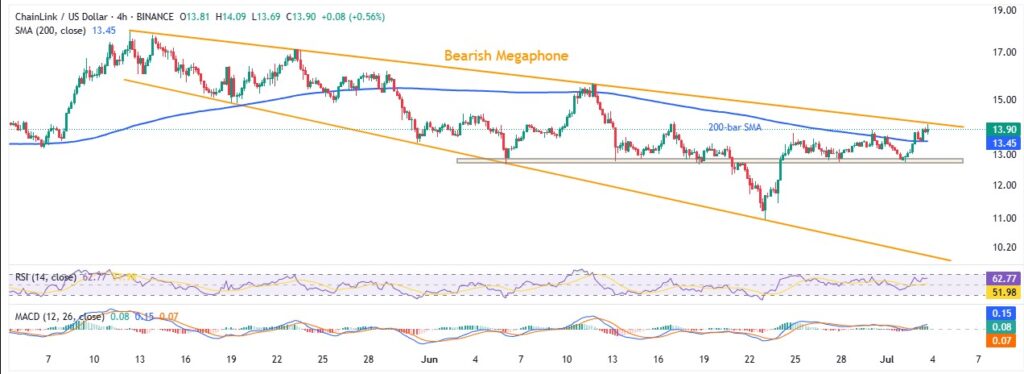
Source: TradingView
On the four-hour chart, Chainlink faces immediate resistance near $14.10 at the top of a two-month-old “Bearish Megaphone” pattern—just like the daily chart. Still, a strong 200-bar SMA breakout, along with bullish 14-bar RSI and MACD signals, keeps buyers hopeful.
If LINK/USD manages to break past this barrier, it could climb toward June’s peak at $15.66, then aim for May’s swing highs near $16.60 and $17.97, just below the $18.00 psychological level. Beyond that, attention would shift to key resistance levels from the daily chart.
Alternatively, a drop below the 200-bar SMA at $13.45 may trigger fresh selling pressure, targeting horizontal support near $12.70. A break there could open the door toward the June low of $10.96, and possibly the megaphone pattern’s base around $9.97.
Overall, Chainlink remains bullish in the short term and may challenge previous highs, but fully reversing its 2025 losses seems unlikely—unless fueled by strong fundamental catalysts.