
- Aave buyers struggle to defend three-month uptrend in July, down 12% so far in 2025.
- Inverse head-and-shoulders, 200-day EMA strength, and solid support line keep AAVE bulls hopeful.
- MACD and RSI hint at short-term consolidation for AAVE/USD.
- Bears hold control below $224, but a break above $310 could ignite a rally.
Aave (AAVE/USD) is mildly bid near $278 this Sunday, struggling to defend a strong 3-month rally before July. That said, the token has already dropped 12% since the start of 2025, leaving traders unsure of what’s next.
Despite the latest inaction, the altcoin’s bullish outlook remains intact thanks to the formation of an inverse head-and-shoulders (H&S) pattern, steady trading above the 200-day Exponential Moving Average (EMA), and a strong three-month-old ascending support line.
Also supporting this positive bias are the encouraging signals from the 14-day Relative Strength Index (RSI) and the Moving Average Convergence Divergence (MACD) momentum indicators, keeping AAVE buyers hopeful for a potential rebound.
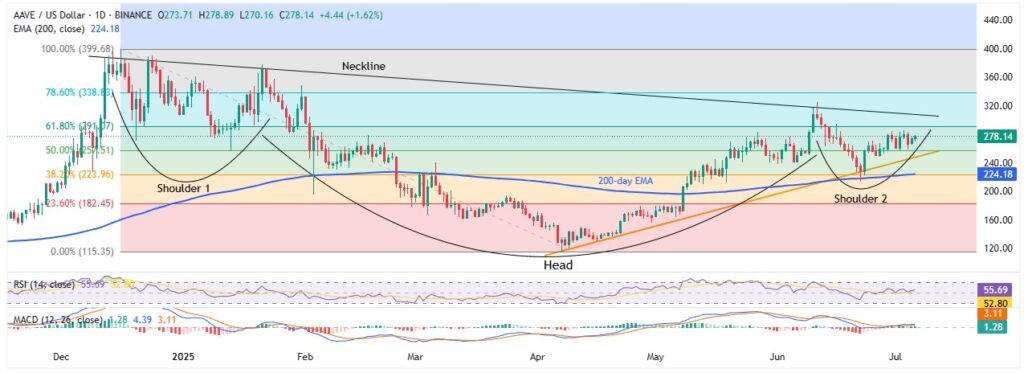
AAVE/USD: Daily chart highlights inverse H&S
Source: Tradingview
On the daily chart, AAVE/USD remains well above key supports—the ascending trend line from early April near $248.00 and the 200-day Exponential Moving Average (EMA) around $224.00.
Also challenging bearish pressure is an eight-month-old inverse head-and-shoulders pattern with a neckline near $310.00. The RSI hovers close to 50.00, while the MACD shows bullish signs, indicating a likely short-term sideways move.
A break below $224.00 would invalidate the bullish pattern, potentially pushing AAVE down toward the late March swing high near $186.00, with $200.00 as an intermediate support.
Alternatively, clearing $310.00 would confirm the inverse head-and-shoulders pattern, pointing to a theoretical target of $585.00—though resistance lies ahead at the late 2024 peak of $395.81, the 2021 high of $455.00, and the $500.00 mark.
AAVE/USD: Four-Hour chart signals sideways performance

Source: Tradingview
Unlike the daily chart, the four-hour RSI and MACD for AAVE/USD show weaker bullish signals, hinting at a possible pullback. However, key supports near the 200-bar EMA at $261.00 and the eight-week-old horizontal zone between $210.00 and $215.00 may hold off sellers.
On the upside, the double tops around $285.00 act as immediate resistance, with a break potentially opening the way to $300.00, $310.00, and June’s high of $325.00. Following that, the daily chart levels will gain the market’s attention.
Overall, AAVE lacks upside momentum for the short-term but the broader bullish recovery trend is expected to continue.