
- Floki and Celestia gain over 10% in July after falling more than 50% in 2025.
- FLOKI/USDT crossed key resistance confluence, tempting buyers amid upbeat oscillators.
- TIA/USD trades within a two-week bullish channel near record lows, signaling a potential pullback.
Floki (FLOKI/USDT) and Celestia (TIA/USD) prices rose over 11% and 15% respectively in July, reaching $0.00008320 and $1.606 during Monday’s U.S. session, as traders look to recover from significant 2025 losses of approximately 53% and 65%.
FLOKI crossed a key technical resistance and is poised to continue its recent rally, supported by positive signals from the Relative Strength Index (RSI) and the Moving Average Convergence Divergence (MACD) momentum indicators, also known as oscillators.
In contrast, the TIA/USD pair remains within a two-week-old bullish trend channel near its all-time low but shows weak momentum signals, suggesting a potential short-term price pullback.
FLOKI/USDT: Daily chart points to beginning of Bull-Run
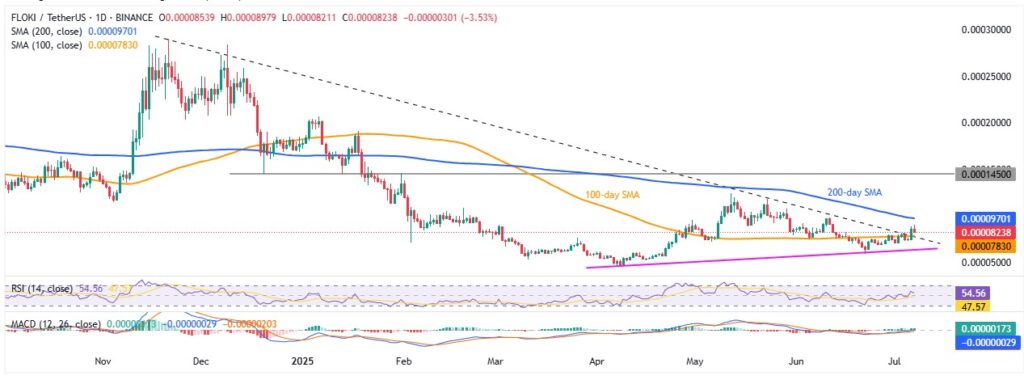
Source: Tradingview
Even though Floki pulled back slightly from a three-week high and posted its first daily loss in three sessions, it still holds above the key support at $0.00007830—a level formed by the 100-day Simple Moving Average (SMA) and a descending trend line from late November 2024. That said, the RSI remains above 50, and the MACD signals stay bullish, pointing to a likely continuation of the FLOKI/USDT pair’s gradual upward momentum despite the recent dip.
If FLOKI/USDT falls below the $0.00007830 support, the three-month-old ascending support near $0.00006400 will act as the last line of defense before prices could slide to the yearly low at $0.00004545 and then the 2023 record bottom near $0.00001525.
On the upside, the 200-day Simple Moving Average (SMA) around $0.00009700 could attract buyers during the recovery, likely pushing FLOKI toward May’s high of $0.0001237. However, a strong resistance zone near $0.0001450 from late December 2024 remains a significant hurdle for bulls to regain full control.
TIA/USD: Four-Hour chart keeps bears hopeful
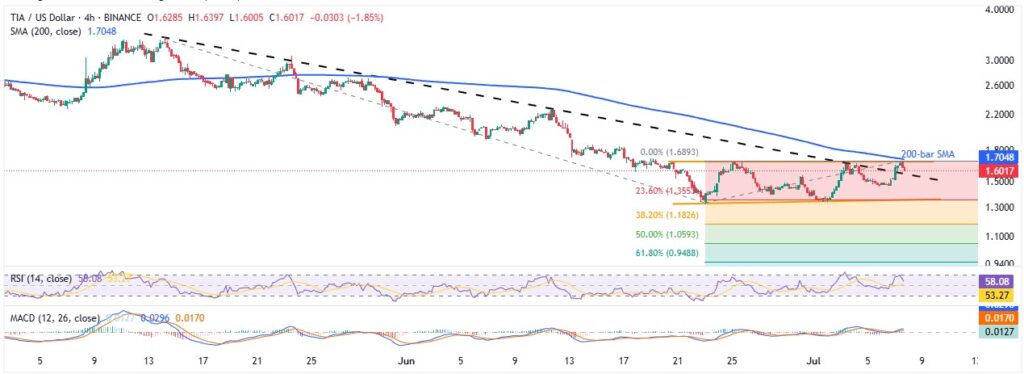
Source: Tradingview
Unlike Floki, Celestia (TIA/USD) remains under bearish pressure despite crossing a seven-week-old resistance. This is partly due to the recent retreat from the upper boundary of a two-week bullish channel and failure to break above the 200-bar SMA. Additionally, the RSI pulling back from the overbought 70 level reinforces short-term bearish sentiment.
Still, bullish signals from the MACD highlight a critical resistance-turned-support line near $1.57. A break below this level could trigger a swift drop toward Saturday’s low around $1.4580, followed by the bottom of the bullish channel near $1.3550.
If prices weaken further below $1.3550, the chances of a gradual slide toward the record low near $1.32 increase. In that scenario, the 38.2%, 50.0%, and 61.8% Fibonacci Extensions of May-July price moves—located around $1.1825, $1.0590, and $0.9490 respectively—will become key levels to watch.
Conclusion
Floki shows signs of a potential bull run, supported by strong technical indicators and key support holding firm. In contrast, Celestia remains under bearish pressure with weak momentum and critical support levels at risk. Overall, Floki looks set for gradual recovery, while Celestia faces possible further declines unless it breaks key resistance. Traders should watch these levels closely for the next move.