- Ethereum price crosses short-term key resistance within a broader “Rising Wedge” pattern.
- RSI above 60.00, bullish MACD signals back trendline breakout to favor ETH buyers.
- ETH/USD bears remain off the table unless prices break $2,350.
Ethereum (ETH/USD) surged 1.80% intraday to $2,663 during Wednesday’s U.S. session, marking its highest level in three weeks. This move confirms an upside breakout from a key short-term resistance, following a week of sideways action. The breakout is supported by strengthening momentum indicators, signaling renewed bullish interest.
Notably, ETH has crossed a downward-sloping resistance line drawn from June 16, extending its weekend recovery from the 200-day Simple Moving Average (SMA). Further, the 14-day Relative Strength Index (RSI) is gradually rising above the neutral 50.0 level, indicating improving strength while staying well below overbought territory. At the same time, the Moving Average Convergence Divergence (MACD) indicator is flashing bullish signals, further supporting the recent price push.
With momentum gaining and technicals aligning, Ethereum now appears set to challenge the upper boundary of the rising wedge, which lies near the $2,900 mark.
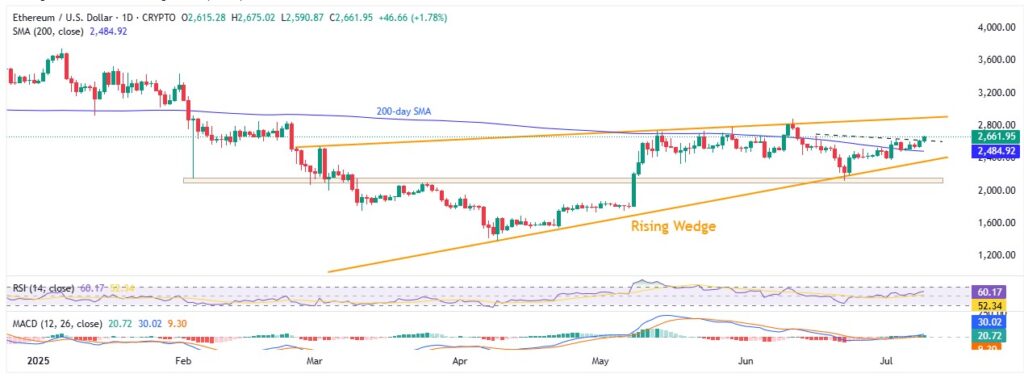
ETH/USD: Daily chart hints at further upside

Source: TradingView
Ethereum’s decisive break above a three-week resistance, combined with a steadily rising but not overbought RSI and bullish MACD signals, points buyers toward the upper line of the rising wedge pattern near the $2,900 level. However, the previous monthly high around $2,880 could act as a key intermediate hurdle for bulls to watch closely.
If buyers manage to push Ethereum above the $2,900 mark, it would invalidate the bearish rising wedge pattern and open the door for a test of the $3,000 level, followed by January highs near $3,440, $3,525, and $3,745.
On the downside, the former resistance line now acting as support, along with the 200-day SMA, is expected to limit Ethereum’s short-term declines around $2,615 and $2,484 respectively. Below these levels, sellers may drive price toward the wedge’s lower support at $2,348. A break below this support would confirm the bearish pattern, targeting a theoretical low near $855.
Between these key points, Ethereum’s bears may find additional support zones around $2,150 to $2,100, the $2,000 psychological level, and the yearly low near $1,385.
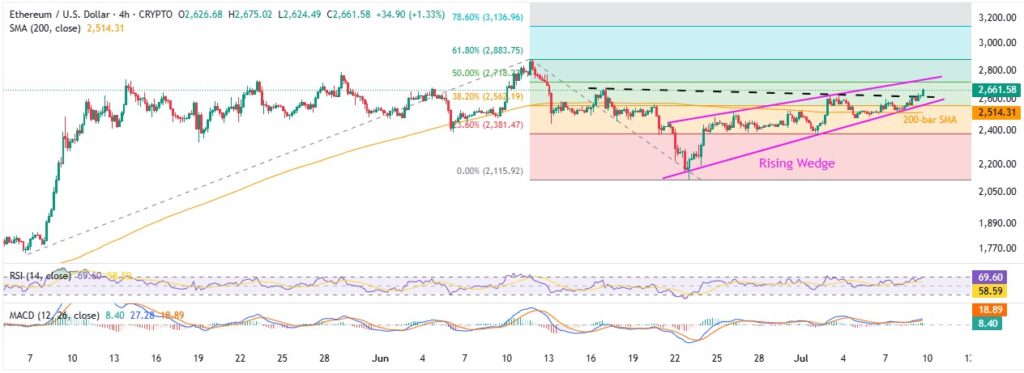
ETH/USD: Four-Hour chart offers more filters

Source: Tradingview
On the four-hour chart, a short-term rising wedge between $2,565 and $2,745 is limiting Ethereum’s price moves, presenting an immediate challenge for bulls before they can target $2,900. The 200-bar SMA support at $2,514 provides a strong downside cushion, even if bears push prices below $2,565 and confirm a wedge breakdown.
Alternatively, if buyers clear the $2,745 resistance, they will likely aim for the previous monthly high near $2,880 and then the $2,900 mark, alongside the key technical levels highlighted on the daily chart.
Overall, Ethereum has finally made the long-awaited upside break after a week of sideways trading, signaling a potential run-up toward the next major resistance that could unlock a broader bull-run.


