- Ethereum hits five-month high after breaking key resistance amid bullish catalysts.
- Strong institutional demand and reduced liquid supply from staking fuel ETH/USD prices.
- Rising ETH/BTC ratio shows increasing trader confidence in Ethereum over Bitcoin.
- ETH bulls have room to grow as “Crypto Week” approaches.
Ethereum (ETH/USD) jumps to the highest level since early February, hitting nearly $3,030 during a strong four-day rally on Friday. Although the ETH/USD pair pulled back slightly to around $2,996 by the European session, the momentum remains solid.
ETH’s surge follows Bitcoin’s fresh all-time high, boosting overall crypto optimism. However, the Ethereum bulls have even more reason to celebrate, with rising institutional investments, a supply squeeze from increased staking, and strong ecosystem optimism driving the price up.
Confidence in Ethereum is also growing compared to Bitcoin, as seen in the rising ETH/BTC ratio, alongside a key technical breakout past a multi-month resistance line—signaling further upside potential.
“Smart Money” Leads Ethereum Buyers
Among the key catalysts driving Ethereum’s rally, surging institutional interest stands out. A recent report from CoinShares, shared by BlockChain News, reveals that Ethereum-focused digital asset investment products have attracted nearly $2.9 billion in net inflows year-to-date, with $429 million pouring in over just the past week—highlighting rapidly growing institutional appetite.
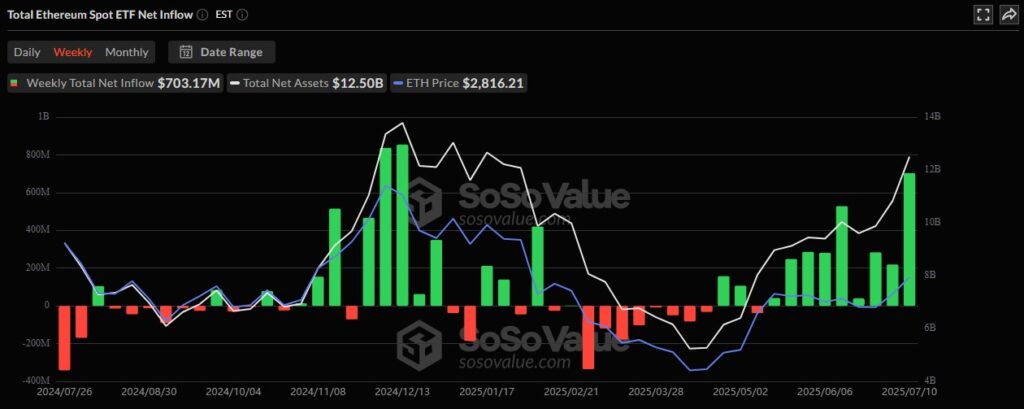
Further reinforcing this trend, data from SosoValue shows that U.S.-based spot Ethereum exchange-traded funds (ETFs) have recorded around $2.40 billion in inflows so far in 2025. Notably, $703.17 million of that came in during the most recent week, pointing to a sharp uptick in large-scale ETH exposure among professional investors.
Weekly Inflows of US ETH spot ETF

Source: SosoValue
Monthly Inflows of US ETH spot ETF

Source: SosoValue
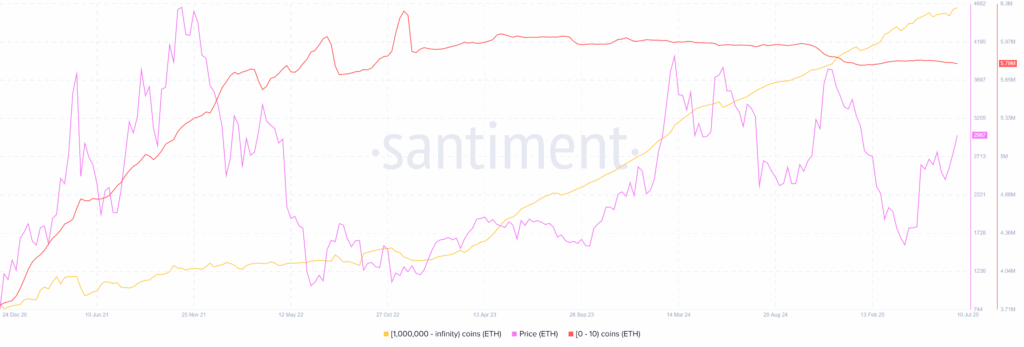
Beyond institutional buying, on-chain data reveals that whales are increasingly accumulating Ethereum, outpacing retail investors and helping drive ETH/USD prices higher. According to Santiment, wallets holding over 1 million ETH (classified as whales) have boosted their holdings to a record 72.9 million ETH—up from 72.62 million last week. In contrast, smaller wallets holding between 0 and 10 ETH (retail traders) reduced their total holdings slightly to 5.79 million ETH, down from 5.8 million on July 3.
Whale vs. Retail Scenario

Source: Santiment
Staking-driven Supply Crunch Reinforces ETH’s Bullish Bias
In addition to institutional inflows and whale activity, a fresh supply crunch driven by increased staking has helped fuel ETH/USD’s latest rally. On-chain data shows ETH balances on exchanges continue to decline, while over 35 million ETH—nearly 28% of the total circulating supply—is now locked in proof-of-stake contracts. This sharp reduction in liquid supply tightens demand-supply dynamics, giving a strong boost to Ethereum prices.
Ecosystem Optimism Favors ETH/USD
Alongside strong institutional inflows and a staking-driven supply crunch, growing optimism within the Ethereum developer community is adding momentum to ETH/USD prices.
Robinhood recently announced it is building its own Layer-2 (L2) scaling solution on Ethereum network, leveraging Arbitrum’s technology stack. The new L2 aims to support core Web3 features like native ETH staking, tokenized stock trading, and perpetual futures—potentially onboarding millions of retail users into the Ethereum ecosystem, according to Blockchain News.
At the same time, Ethereum co-founder Vitalik Buterin introduced a new digital identity system based on zero-knowledge proofs. This privacy-focused framework marks a major step toward enabling secure, scalable decentralized applications (dApps) that manage sensitive user data.
Both developments are being showcased at the ongoing Ethereum Community Conference (EthCC) in France, which has drawn over 6,400 attendees and reflects the growing strength and engagement of Ethereum’s developer ecosystem.
ETH/BTC Signals Ethereum’s Lead over Bitcoin
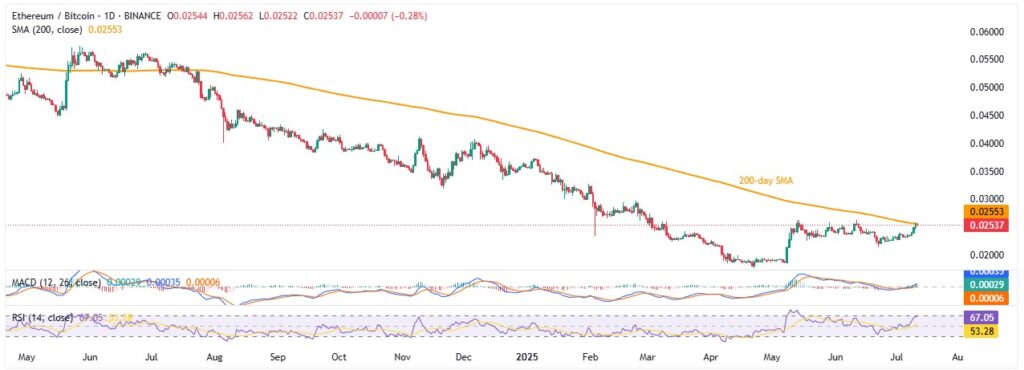
On a different page, the ETH/BTC ratio surged to its highest level in a month, crossing the 200-day Simple Moving Average (SMA) for the first time since July 2024. This move signals that Ethereum isn’t just following the broader market rally but is actively outperforming Bitcoin. Such strength often indicates a healthy altcoin market, with capital rotating into projects backed by strong fundamentals.

Source: Tradingview
Short Liquidations also Added Sterength to ETH Upside
In addition to the earlier catalysts, data from Coinglass reveals that a wave of short liquidations also fueled the latest ETH/USD rally. Roughly $1.01 billion in crypto short positions were wiped out, affecting over 232,000 traders. Of that, about $570 million came from Bitcoin shorts, while Ethereum shorts accounted for approximately $206.93 million per the CoinGlass data.
Technical Analysis
Beyond strong fundamentals, Ethereum’s technical setup also favors bulls. ETH/USD recently broke above an ascending trendline from late February, near $2,910 at press time. This follows an early-July breakout above the 200-day Simple Moving Average (SMA), further supported by bullish signals from the Moving Average Convergence Divergence (MACD) indicator.
However, the 14-day Relative Strength Index (RSI) is hovering above the overbought threshold of 70.00, hinting at a possible short-term consolidation before the next leg higher.
ETH/USD: Daily chart keeps buyers in driver’s seat

Source: TradingView
While the RSI suggests a potential consolidation in ETH/USD, resistance near $3,072—aligned with the 61.8% Fibonacci retracement of the December 2024 to April 2025 decline—remains a key level to watch. However, a sustained breakout above a descending trendline from late February, bullish MACD signals, and a successful hold above the 200-day SMA keep bullish hopes alive.
If ETH clears the $3,072 hurdle, the next upside targets sit near the late January highs at $3,437 and $3,525, followed by the 2025 peak around $3,743.
On the flip side, a daily close below the former resistance-turned-support at $2,910 could invite profit-taking, opening the door toward the 50% Fibonacci level at $2,750, and possibly down to the 200-day SMA near $2,482.
That said, a strong horizontal support zone between $2,150 and $2,115—established since early February—could act as a major floor, making it difficult for bears to regain control.
Conclusion
Ethereum’s surge is driven by strong institutional demand, whale buying, and a supply crunch from increased staking. Developer optimism—fueled by Robinhood’s Layer-2 project and Vitalik Buterin’s identity innovation—adds to the bullish outlook. Meanwhile, a rising ETH/BTC ratio and major short liquidations further strengthen Ethereum’s momentum. Although a short pause is possible, breaking $3,072 could open the door to new highs near $3,500. Overall, Ethereum’s solid fundamentals and growing ecosystem signal more upside ahead.


