- Ripple surges past major hurdles, reaching its highest level in six months.
- Bullish MACD signals and broader crypto optimism boost XRP’s upward momentum.
- The overbought RSI suggests a possible pause near the previous record high before XRP/USD reaches the $4.00 mark.
Ripple (XRP/USD) rallies over 7% on Thursday, challenging late January’s high near $3.25 as bulls celebrate a powerful breakout above a 4.5-month-old resistance zone. Fueled by bullish signals from the Moving Average Convergence Divergence (MACD) and a wave of crypto market optimism sparked by progress on landmark crypto bills in the U.S. House of Representatives, XRP is capturing traders’ attention.
Still, the 14-day Relative Strength Index (RSI) flashes overbought warnings, while geopolitical and trade tensions cast a cautious shadow. All eyes now focus on the critical $3.40 barrier—the January record high—standing between XRP and the ambitious $4.00 target for eager bulls.
XRP/USD: Daily Chart Suggests Bullish Wave Faces Key Hurdle

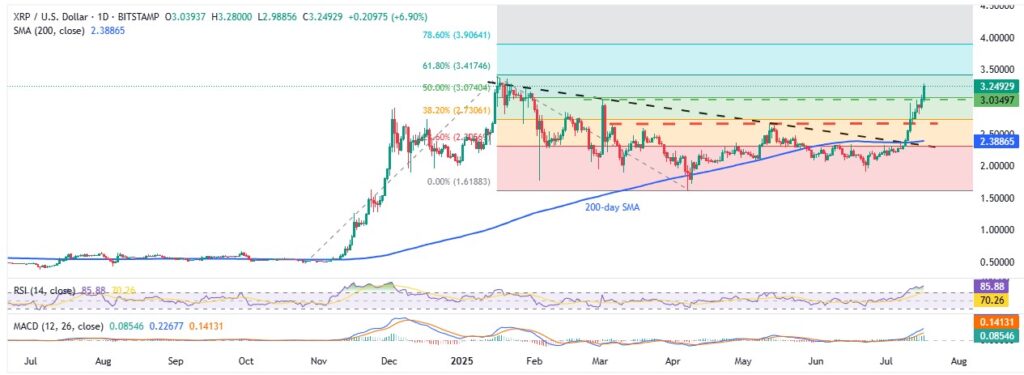
The XRP/USD pair has successfully broken multiple resistance levels dating back to January and March, bolstered by bullish MACD signals and strong crypto market optimism, indicating potential for further upside. However, the overbought 14-day RSI at 86.17 signals caution as the price approaches the yearly and all-time high of $3.40, which remains a critical resistance hurdle.
If Ripple buyers overcome the overbought RSI and push past the $3.40 level, the next key targets will be the 78.6% Fibonacci Extension (FE) of the move between October 2024 and April 2025, near $3.90, followed closely by the widely discussed $4.00 target.
On the downside, a daily close below a horizontal support line from early March, around $3.03, and the $3.00 psychological round figure would signal short-term selling pressure. Further bearish targets include a 4.5-month-old trendline near $2.65 and the 200-day Simple Moving Average (SMA) close to $2.38. Beyond these, a downward-sloping resistance line from January near $2.30 stands as the final support level defending the Ripple bulls.
XRP/USD: Four-Hour Chart Signals Limited Upside Potential

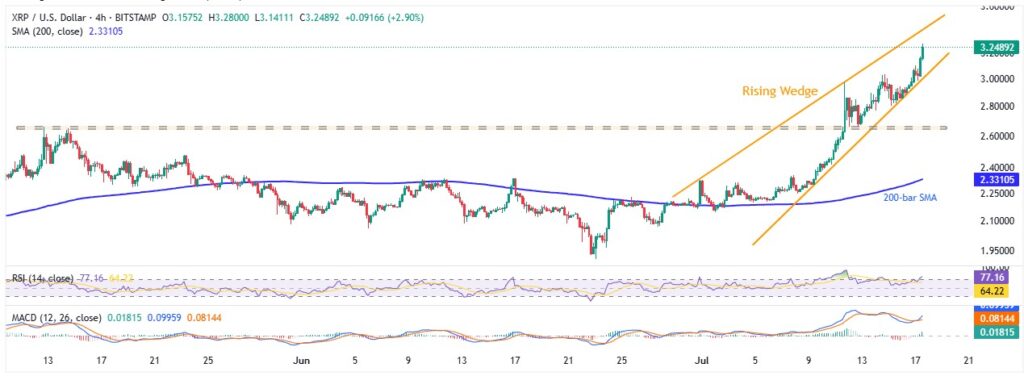
On the four-hour chart, XRP/USD is forming a short-term rising wedge—a bearish chart pattern—currently trading between the $3.40 resistance and $3.00 support, which defines the key range for near-term action. With the RSI in overbought territory, XRP bulls appear to be losing momentum near the $3.40 mark, increasing the likelihood of a pullback toward the critical $3.00 support.
A decisive break below $3.00 would confirm the rising wedge breakdown, opening the door to a swift drop toward the two-month-old horizontal support near $2.65. Sustained weakness below that zone could expose further downside targets at the 200-bar SMA round $2.33, and even the wedge pattern’s theoretical target near $1.85, putting XRP bears firmly in control.
On the flip side, if XRP manages to decisively clear the $3.40 resistance, the bulls could re-target the $4.00 mark, with an eye on the $5.00 level—as previously outlined in the daily chart outlook.
Bottom line: XRP/USD remains technically overextended. While the broader trend is bullish, a healthy pullback before attempting a new all-time high (ATH) can’t be ruled out.


