- Dogecoin price consolidates after hitting a one-week low, following its sharpest daily drop since early April.
- DOGE dips from 5.5-month resistance as overbought RSI sparked sell-off toward 200-day SMA and two-week support.
- RSI within 50-70, bullish MACD, and solid support levels limit DOGE downside chances.
Dogecoin (DOGE) bears lick their wounds around $0.2320, after hitting a one-week low of $0.2220, during early Thursday. In doing so, the DOGE sellers take a breather following the biggest daily slump since early April.
That said, the quote’s previous fall could be linked to its inability to cross key resistance ranging from early February amid the overbought conditions in the 14-day Relative Strength Index (RSI). However, with the latest decline, the RSI is back into the generally upbeat region of between 50-70, which in turn joins bullish signals from the Moving Average Convergence Divergence (MACD) indicator and strong technical supports to test the DOGE/USD sellers.
DOGE/USD: Daily Chart Test Bears

Dogecoin’s (DOGE) failure to cross mid-February high on the daily closing basis joined overbought RSI to trigger the quote’s fresh fall. The south-run gained additional support from breaking a seven-month-old horizontal support area. However, the bullish MACD signals, the return of RSI to 59.30 mark and proximity to the 200-day SMA seem to restrict further downside of the DOGE/USD pair.
With this, the recovery hopes remain alive unless the quote’s provides a daily closing below the 200-day SMA support of $0.2170.
Following that, the previous support line from December 2024 and a 4.5-month-old horizontal support, respectively near $0.1610 and $0.1430, will gain the DOGE bear’s attention.
Alternatively, DOGE rebound needs validation from the aforementioned horizontal resistance zone stretched from December, close to $0.2545-$0.2625. Also challenging the DOGE/USD buyers is the double tops around $0.2870, a break of which could direct prices toward the $0.3000 threshold and then to the late-December swing high surrounding $0.3050.
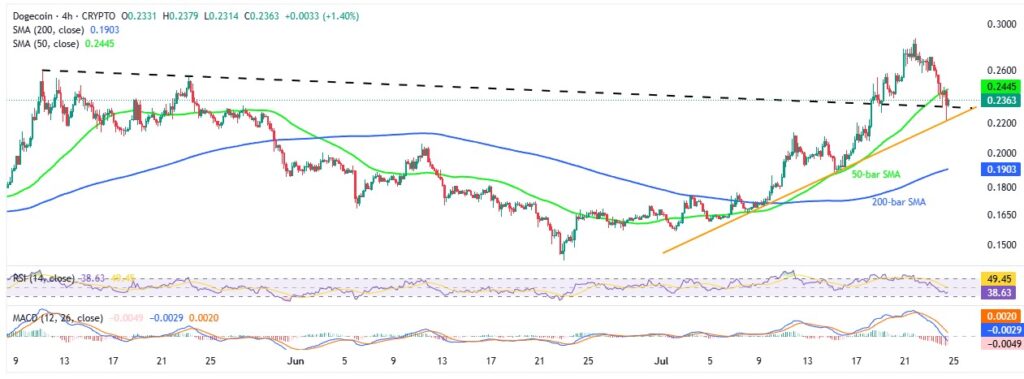
DOGE/USD: Four-Hour Chart Hints At Recovery

Unlike the daily chart, the four-hour chart portrays the oversold RSI conditions and nearness to the 10-week-old previous resistance line, as well as a fortnight-long rising trend-line support. This suggests immediate rebound in the DOGE/USD prices toward the short-term upside hurdle, namely the 50-bar SMA of $0.2445.
However, $0.2580 and the latest peak of around $0.2875 could challenge the Dogecoin buyers before giving them control.
On the flip side, a multi-week-old resistance-turned-support restricts immediate DOGE downside near $0.2310, followed by a fortnight-long trend line support of $0.2220. In a case where the DOGE/USD price remains weak past $0.2220, the 200-bar SMA support of $0.1900 will act as the final defense of the buyers.
Overall, the Dogecoin bears lack acceptance and hence a corrective bounce is expected. However, the return of the bullish trend and reversal of 2025 losses appears difficult at the moment.


