- Ethereum eyes the first weekly loss in five, extends Monday’s gradual descend to key support level.
- Early-week Doji candlestick, RSI pullback from overbought territory lure ETH bears amid market consolidation.
- ETH/USD bears attack fortnight-long support to pare biggest monthly gain of 2025.
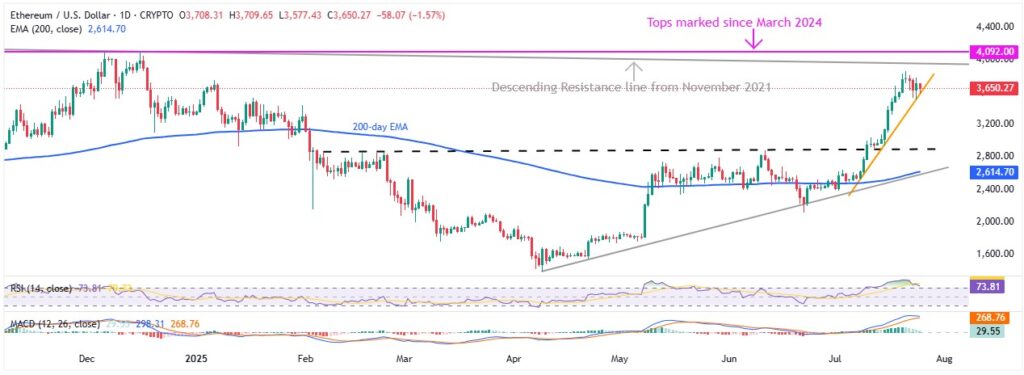
Ethereum price (ETH/USD) loses more than 1.0% intraday to $3,650 as it extends the week-start gradual pullback to a short-term key support early Friday. In doing so, the second-largest cryptocurrency braces for the first weekly loss in five while trimming the biggest monthly gain of 2025 as month-end positioning joins mixed market sentiment..
It’s worth mentioning that Monday’s Doji candlestick at the yearly high and the latest pullback in the 14-day Relative Strength Index (RSI) from overbought territory seems to have favored the ETH/USD sellers of late. Even so, a two-week-old ascending support line challenges the quote’s further downside despite a looming bear cross on the Moving Average Convergence Divergence (MACD) indicator.
ETH/USD: Daily Chart Teases Sellers as Ethereum Price Trades Lower

Even after hitting a fresh yearly high on Monday, the ETH/USD pair posted a Doji candlestick by the day’s end, suggesting buyers need a breathing break. This pullback bias also gained support from the overbought RSI conditions and pushed prices slowly toward an ascending trend line support from July 08, close to $3,580 at the latest
Given the looming bear cross on the MACD and the market’s month-end consolidation amid the US Dollar’s rebound, the ETH/USD pair might break the immediate $3,580 support. The same could direct sellers toward the top, made in late January, around $3,525 and $3,437.
However, the ETH’s weakness past $3,437 makes it vulnerable to approach the $3,000 psychological magnet and ascending support line from February, previous resistance surrounding $2,890. The 200-day Exponential Moving Average (EMA) and rising trend line from early April, respectively near $2,615 and $2,590, appear tough nuts to crack for the bears afterward.
Alternatively, ETH’s rebound can aim for a yearly high of $3,858 and a descending resistance line from November 2021, close to $3,955 at the latest, to convince buyers.
Also acting as a strong upside hurdle is the horizontal area surrounding $4,090 – $4,100, comprising tops marked since March.
ETH/USD: Four-Hour Chart Signals Limited Downside Room

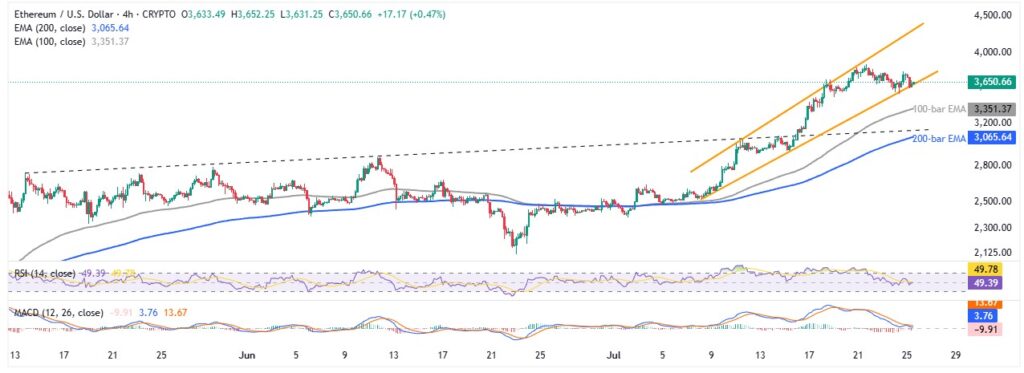
On the four-hour chart, a 17-day-old rising megaphone trend-widening formation restricts Ethereum’s immediate moves between $3,580 and $4,295.
The RSI on the four-hour chart is near the median 50.0 figure, while the MACD signals sluggishly bearish, suggesting continuation of the short-term weakness in prices.
Should the quote break the $3,580 support and defy the megaphone formation, it’s fall toward the 100-bar EMA ($3,345), previous resistance from May around $3,130, and the 200-bar EMA support of $3,060 could grab the market’s attention.
Meanwhile, ETH/USD recovery can initially aim for the latest peak of $3,780 before challenging the yearly high of around $3,860. That said, ETH’s sustained trading past $3,860 can aim for the $3,955, $4,000, and $4,100 resistances ahead of directing the bulls toward the stated megaphone’s top of $4,295.
Overall, ETH is likely to witness a short-term pullback in prices, but the overall bullish trend could prevail


