- Solana price renews weekly low during three-day losing streak, paring losses of late.
- 66% capacity boosts to Solana Protocol, MoonPay news struggle to convince buyers.
- Long liquidations, bearish on-chain signals and legal woes weigh on SOL/USD amid broad crypto market consolidation.
- SOL’s further downside hinges on $170.00 break and fundamental catalysts.
Solana price drops for the third consecutive day on Friday to hit a weekly low, before bouncing off the bottom to $180.55 by the press time.
That said, the SOL’s latest rebound could be linked to the news suggesting a capacity boost for the Solana Protocol and MoonPay’s staking offer.
However, looming legal fears and downbeat on-chain signals join long liquidations to direct sellers toward the short-term key support surrounding $170.00.
Recent Positives for Solana Price
Earlier in the day, Solana Daily said on X (formerly Twitter) that Solana upgrades for a major capacity lift as SIMD-0286 proposes raising block limits from 60M to 100M compute units – a huge 66% increase to handle higher network demand and DeFi growth.
Read Details Here: Solana SIMD-0286 Upgrade Proposes 66% Block Capacity Boost to Tackle Surging DeFi Demand.
Also challenging the SOL bears was the previous news suggesting the global payment giant MoonPay’s Solana staking offer to its 30 million users, outside the European Economic Area (EEA) and New York.
With this, MoonPay enters the crypto yield game with an 8.49% Solana staking proposition to clients with just $1 minimum with no lock-up periods.
Also Read: MoonPay Enters Crypto Yield Game With 8.49% Solana Staking
Catalysts Luring Solana Bears
Among the top-tier catalysts, the crypto market’s consolidation of July’s gains, especially amid the recent rebound in the US Dollar, attracts major attention. That said, the US Dollar Index (DXY) prints a two-day winning streak on Friday amid easing concerns suggesting a forced leadership change in the U.S. Federal Reserve (Fed) and its likely harm to the Greenback.
Additionally, mixed headlines surrounding the U.S. trade deals with the major global economies and U.S. President Donald Trump’s political stance also allowed the USD to pare weekly losses, which in turn offers a breathing space to the cryptocurrency bulls after a stellar “Crypto Week” gains.
Apart from the macro catalysts, the long liquidations of Solana, as per the CoinGlass data, also justify the latest fall in the SOL/USD prices.

The latest graphic from the CoinGlass suggests that there has been a total of $170.68 million worth of Solana liquidations from July 21 to July 25, out of which $116.8 million (roughly 68%) were long (buy) positions, whereas $53.8 million were short (sell) positions. That said, data for Friday signals $26.6 million of long liquidations and $4.3 million of short liquidations. Hence, a major rush towards profit-booking seemed to have been the key catalyst behind the latest SOL decline.
CryptoQuant’s Taker CVD (Cumulative Volume Delta) for Solana also signals selling pressure with the negative print. This 90-day metric tracks the cumulative difference between buy and sell SOL volumes over three months.
That said, if the outcome is positive and rising, it suggests the Taker Buy Dominant Phase, increasing hopes of further upside. Meanwhile, a negative and decreasing Taker CVD value points to the Taker Sell Dominant Phase, which is currently for Solana, and hints at a potential south-run.
Elsewhere, law firm Burwick Law filed a class-action lawsuit against the Solana-based memecoin creator Pump.fun in the Southern District of New York. The legal firm announced the filing of an amended complaint on behalf of plaintiffs alleging RICO claims against Pump.fun, Solana, Jito, and their respective officers in Aguilar vs. Baton Corporations.
Technical Analysis
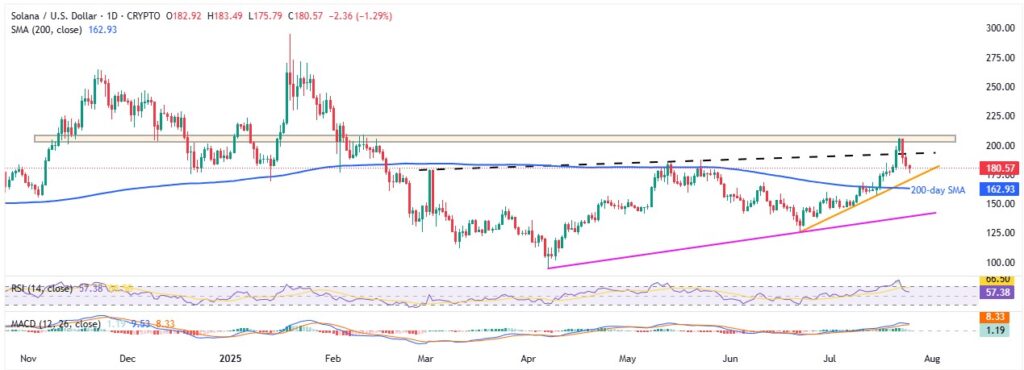
In addition to the aforementioned catalysts, technical analysis also suggests further downside for the SOL/USD pair even if the reversal of July’s heavy gains, around 16.0%, seems less likely for the short term.
SOL/USD: Daily Chart Signals Further Weakness

SOL’s failure to cross a horizontal resistance zone from November 2024, between $203.00 and $210.00, joins a pullback in the 14-day Relative Strength Index (RSI) from the overbought territory and a potential bear cross on the Moving Average Convergence Divergence (MACD) indicator to lure bears.
However, a five-week-old ascending support line surrounding $170.00 appears important to determine further SOL/USD weakness. Should the quote drop beneath the same, the 200-day Simple Moving Average (SMA) can test the sellers near $162.00 before allowing them to revisit an upward-sloping trend line support from early April, around $140.00 by the press time.
Meanwhile, Solana’s recovery can initially aim for an ascending trend line from March, close to $193.00, before targeting the $200.00 threshold. However, the real test for the SOL bulls will be at $203-$210, a break of which could give them control to aim for the yearly high surrounding $295.00, with the $223, $245, and $265 likely acting as intermediate halts.
Conclusion
Solana’s latest legal troubles and profit-booking favor the SOL/USD bears, especially amid downbeat on-chain catalysts. However, the fundamental developments still keep the SOL buyers hopeful unless the price drops back below the 200-day SMA.


