- Binance Coin bulls are on a roll during four-day uptrend as they refresh ATH.
- Nasdaq-listed Windtree eyes $520M BNB buy to boost treasury holdings.
- Overbought RSI and trendline from mid-2024 could test BNB’s rally near $885.
- Pullback risks loom for BNB/USD, with $794 and $780 eyed, upside break of $885 highlights $1K threshold.
Binance Coin (BNB/USD) extends its four-day winning streak, refreshing its all-time high (ATH) near $860.00, close to $845.00 by the press time on Monday. The Centralized Exchange (CEX) token gains momentum after Nasdaq-listed Windtree announced plans to add $520 million worth of BNB for its corporate treasury.
The weekend breakout above the $794.00 resistance level, which previously challenged BNB bulls, also favors the upside bias. It’s worth noting that the breakout was reinforced by bullish signals from the Moving Average Convergence Divergence (MACD) indicator, as well as successful trading past key Simple Moving Averages (SMAs), to keep buyers optimistic.
However, overbought conditions of the 14-day Relative Strength Index (RSI) and nearness to the upper boundary of a 13-month-old ascending bullish channel could allow a breathing space to the BNB/USD bulls.
Binance Coin: Daily Chart Signals Limited Upside Room

Even after crossing the December 2024 high and successfully trading above the 200-day and 50-day SMAs, as well as gaining support from the bullish MACD signals, the Binance Coin (BNB/USD) bulls may witness a barrier to their further upside.
Among the key challenges, the overbought conditions of the 14-day RSI hovering around 87.00 and BNB’s nearness to the top boundary of a rising trend channel established since June 2024, close to $885.00, gain major attention.
A decisive break above $885.00 could favor the BNB’s further gains toward the $900.00 and $1,000.00 psychological marks. That said, an upward-sloping trend line resistance from October 2022, near $970.00 by the press time, may act as an additional upside barrier.
Alternatively, a pullback in BNB/USD could revisit the December 2024 peak, surrounding $794.00 before aiming for highs from January and February, near $745.00 and $732.00, respectively.
Following that, the 50-day and 200-day SMAs, currently near $687.00 and $644.00, in that order, could challenge BNB/USD sellers ahead of the lower boundary of the bullish trend channel, around $570.00, which could serve as the final line of defense for the bulls.
Binance Coin: Four-Hour Chart Signals Immediate Pullback

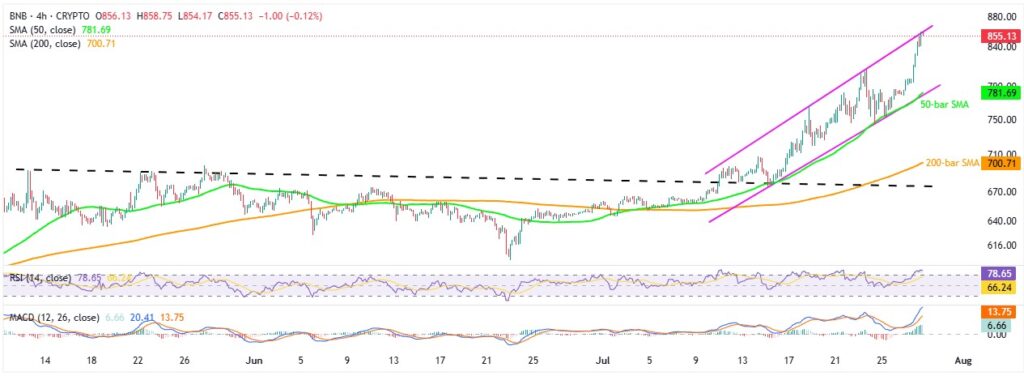
Unlike the daily chart, the BNB/USD pair’s four-hour chart highlights immediate resistance near $860.00, marked by the upper boundary of a two-week-long ascending channel. This could join the overbought RSI to limit the BNB’s short-term upside.
If BNB crosses the $860.00 hurdle, the buyers will target higher resistances outlined on the daily chart, namely around $885.00, $900.00, $970.00, and the psychological magnet of $1,000.00.
On the flip side, the 50-bar SMA and the lower line of the bullish channel together restrict the short-term downside of the BNB around $780.00.
Following that, the 200-bar SMA around $700.0, and a resistance-turned-support trend line from May, near $675.00, will be the key downside levels to watch.
Overall, BNB bulls have support from technical structure and fundamental news to justify the latest record top, even as an overbought RSI and proximity to key resistance suggest a short-term pause in the upside momentum.


