- Avalanche price prints four-day losing streak as bears poke 200-day SMA.
- Momentum oscillators favor recovery hopes, but reversal of yearly loss hinges on $26.50 breakout.
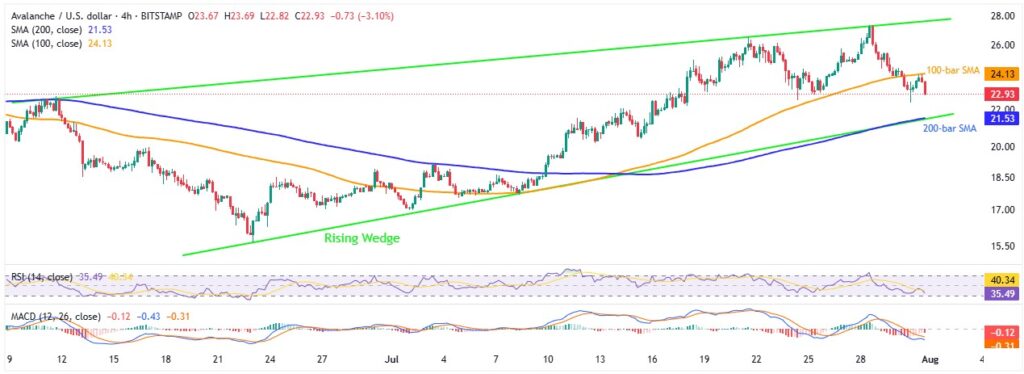
- “Rising Wedge” on the four-hour chart casts doubts on the AVAX rally; bears can cheer $21.50 breakdown.
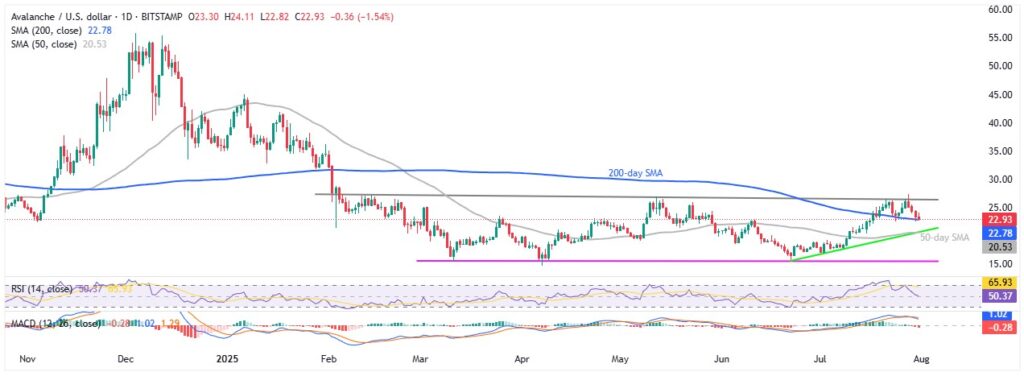
Avalanche (AVAX/USD) price drops for the fourth consecutive day as it pokes the 200-day Simple Moving Average (SMA) heading into Thursday’s U.S. session, down 1.64% intraday to $22.90 by the press time.
Since crossing the 200-day SMA during the mid-July rally, AVAX has twice defended this key support. The quote’s failure to break beneath the important SMA joins neutral conditions of the 14-day Relative Strength Index (RSI) to support recovery hopes.
However, the pair’s latest attempt to break the key SMA, bearish signals from the Moving Average Convergence Divergence (MACD) and a multi-month resistance line to challenge prospects of reversing the yearly 33% loss. That said, the AVAX buyers have so far cheered a 32% monthly gain in July.
Avalanche: Daily Chart Portrays Range-Bound Momentum

Despite strong support from the 200-day SMA, the AVAX/USD pair has remained trapped within a range since February. That said, the latest attack to the key SMA joins a slight uptick in the RSI to suggest another rebound and an attempt to cross the $26.50 resistance, comprising the upper boundary of the said multi-month trading range.
Also acting as an upside hurdle is the monthly high of $27.37 and February 03’s peak surrounding $28.80, a break of which will convince AVAX bulls to try reversing the yearly loss.
In doing so, the $30.00 threshold and mid-November 2024 bottom of $30.70, as well as multiple levels near $34.80, will play their roles as intermediate resistances on the way to the yearly high of $45.04. That said, the $40.00 round figure acts as an extra challenge for the AVAX/USD north-run.
Alternatively, a daily closing beneath the 200-day SMA support of $22.78 could direct the AVAX bears toward a convergence of the 50-day SMA and a five-week-old ascending trend line, close to $20.50, quickly followed by the $20.00 round-figure support.
Should the Avalanche price drop past $20.00, a gradual fall towards the horizontal support from March, near $15.50, and then to the yearly bottom of $14.67, can be expected.
Avalanche/USD: Four-Hour Chart Signals Limited Upside Room

On the four-hour chart, a seven-week-old rising wedge bearish chart formation restricts the AVAX/USD moves between $21.50 and $27.70, with the 100-bar SMA guarding immediate upside near $24.15 while the 200-bar SMA adds strength to the wedge’s lower boundary.
If the AVAX bears manage to conquer the $21.50 support, the theoretical target of $9.80 will be in the spotlight, with the daily chart levels likely offering intermediate supports.
Meanwhile, an upside clearance of $27.70 could quickly boost the Avalanche price to the $30.00 round figure ahead of higher levels discussed on the daily chart.
To sum up, Avalanche’s latest fall to the 200-day SMA could pare some of the July’s gains, but the six-month trading range restricts the quote’s broader moves.


