- Ripple price drops for the third consecutive day, hitting a fortnight’s low after a 35% rally in July.
- Eight-month-old broad horizontal support challenges the XRP/USD pair sellers.
- Pullback from sturdy resistances, bearish MACD signals and downbeat RSI lure XRP bears.
- Multiple key supports stand tall to challenge bearish trend bias; recovery remains elusive below $3.36.
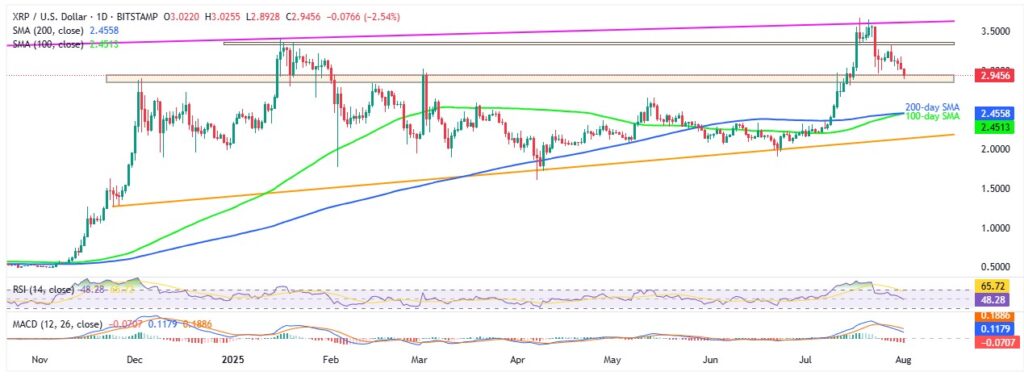
Ripple price (XRP/USD) slides for the third straight day, losing over 2.0% intraday around $2.94 heading into Friday’s U.S. trading session. The XRP’s latest decline brings sellers into focus as they poke an eight-month-old broad horizontal support area.
That said, bearish signals from the Moving Average Convergence Divergence (MACD) indicator and the downbeat 14-day Relative Strength Index (RSI) line, not oversold, also favor a short-term downside for the XRP/USD pair.
Ripple Price: Daily Chart Suggests Bumpy Road For Bears

Failure to break an ascending resistance line from April 2021 and an early-week retreat from the 6.5-month-long horizontal area lures the XRP/USD pair sellers. Adding strength to the downside bias is the below-50.0 RSI line, but not oversold, as well as the bearish MACD signals.
With this, the Ripple sellers appear more inclined towards breaking the immediate support zone surrounding $2.80-$2.95.
Though May’s top of $2.65 and a convergence of the 100-day and 200-day Simple Moving Averages (SMAs) near $2.45 could challenge the XRP bears past $2.80. Following that, an ascending trend line from late November, close to $2.12 at the latest, acts as the final defense of the XRP buyers.
On the flip side, Ripple’s rebound needs to stay beyond the $3.00 threshold to convince traders. Even so, a horizontal area comprising tops marked since mid-January, near $3.33-$3.36, could test the upside momentum.
Beyond that, an ascending trend line from April 2021, near $3.63, and the XRP’s all-time high (ATH) of around $3.66, will be the key resistances to watch for buyers before they aim for the $4.00 threshold.
Ripple Price: Four-Hour Chart Favors Short-term Bears

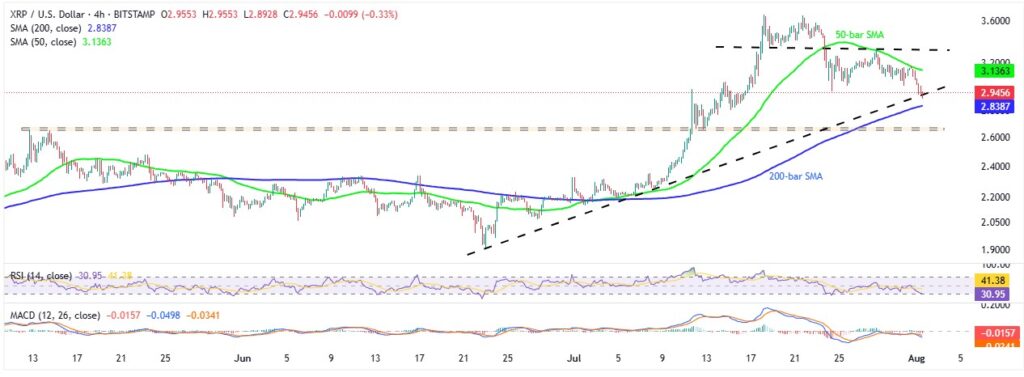
Unlike the daily chart, the XRP/USD pair’s four-hour chart reveals the recent break of a five-week-old ascending support line to convince short-term sellers. The downside bias also takes clues from the bearish MACD signals while directing the Ripple price towards the 200-bar SMA support of $2.83.
However, a horizontal area comprising levels marked since May 12, near $2.68-$2.65, might act as the final defense of the buyers, a break of which will highlight the daily chart levels.
Alternatively, the XRP’s rebound needs to stay beyond the immediate rising trend line support, close to $2.94, to push back the bearish bias. Even so, the 50-bar SMA of $3.13 and a fortnight-old resistance around $3.32 could challenge the bulls before directing them to the highest levels discussed on the daily chart.
Conclusion
Ripple price looks poised for short-term downside following a strong July rally, though a full bearish trend reversal remains unlikely for now.


