- Binance Coin price briefly renewed a record top before pulling back, paring its biggest daily gain in three weeks.
- Momentum indicators remain bullish, but key resistance from the Bollinger Band and channel top challenge BNB buyers amid mixed market sentiment.
- Multiple strong supports prevent bears from taking control.
- Binance Coin’s short-term pullback looks due, despite a firm broader uptrend, eyeing a breakout above the key $900 resistance.
Binance Coin (BNB) price cools to $858.00, after briefly hitting a new all-time high (ATH) around $883.00 early Thursday. Despite the ongoing strong bullish trend, cautious market sentiment and pressure near critical resistance levels seem to have triggered this latest price pullback.
Also read: Market Digest: Bitcoin Climbs Back to 114K as Wall Street Rotates from Tech into Safer Assets
BNB’s daily volume dips from a weekly high to $3.45 billion, and market cap eases from its ATH to $120.32 billion, according to Santiment, signaling strong but cautious trader involvement during the altcoin’s recent rise.
Along with elevated trading volume and a firm market cap, momentum indicators on the daily chart continue to support the Binance Coin’s run-up. However, the four-hour chart suggests a rising likelihood of a short-term price pullback, despite the broader market strength.
Binance Coin Price: Daily Chart Defends Overall Bullish Bias

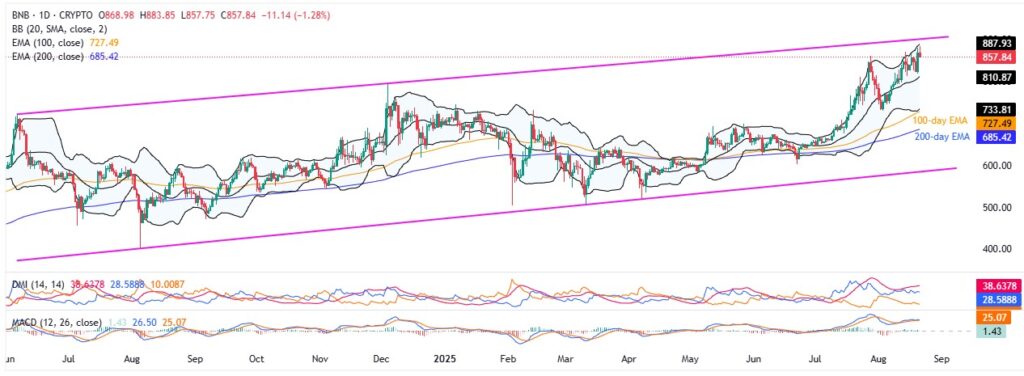
Binance Coin’s recent retreat from the upper Bollinger Band (BB) doesn’t disrupt its broader bullish trend, as portrayed by a 14-month upward-sloping trend channel. Additionally, the BNB’s sustained trading beyond the 100-day and 200-day Exponential Moving Averages (EMAs) also reinforces the strong bullish bias.
Meanwhile, the Moving Average Convergence Divergence (MACD) indicator shows softer, yet bullish signals, whereas the Directional Movement Index (DMI) shows a sturdy momentum support to the BNB’s upside.
Specifically, the DMI’s Upmove line (D+ in blue) holds well above the neutral 25.00 level, and the Average Directional Index (ADX in red) prints a notable 38.00 reading, indicating a solid trend, whereas the Downmove line (D- in orange) remains near 10.00, signaling very weak support for price pullback.
That said, the quote’s latest retreat highlights the middle BB for short-term sellers, currently around $811.00, quickly followed by the $800.00 threshold.
Below that, December’s peak of $794.00 and the lower BB around $733.00 may challenge the Binance Coin bears before the 100-day and 200-day EMAs, respectively near $727.00 and $685.00, come into play.
Even if the BNB price breaks the 200-day EMA support, the aforementioned channel’s bottom, near $580.00, will act as the final defense for buyers.
Alternatively, the Binance Coin’s breakout above the upper Bollinger Band (BB), around $890.00, would require confirmation from the multi-month bullish channel’s top at $900.00, the key resistance, before the BNB bulls can aim for the psychological milestone of $1,000.
Binance Coin Price: Four-Hour Chart Suggests Short-Term Pullback

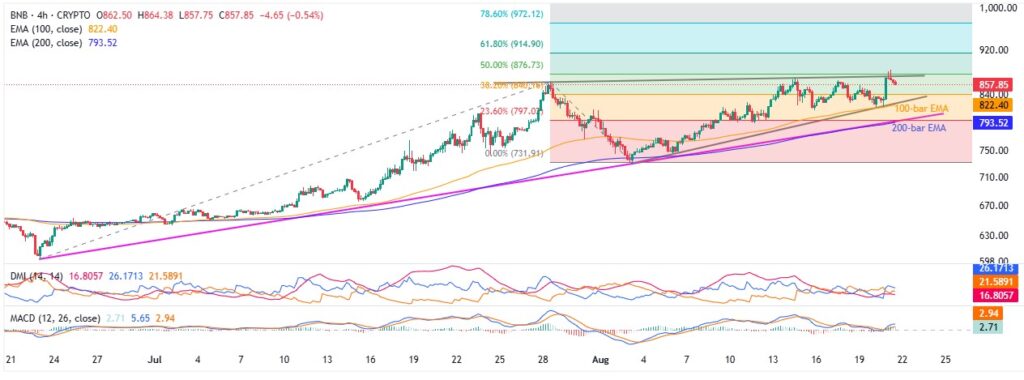
The Binance Coin’s latest pullback could be linked to its failure to stay beyond a three-week resistance, close to $875.00.
It’s worth noting that the DMI indicator signals a short-term pullback, as the Downmove line (D- in orange) remains above the Upmove line (D+ in red). However, the ADX line (blue) stays well past the 25.00 threshold, citing strong trend momentum, and aligns with the bullish MACD signals to confirm the broader uptrend.
With this, the BNB may visit a convergence of the 100-bar EMA and a fortnight-long rising trend line support, near $821.00.
If Binance Coin fails to rebound from the $821.00 support level, the focus will shift to the $792.00 mark, including the 200-bar EMA and an ascending trendline from late June. This zone will be critical, as a breakdown here could open the door to deeper downside levels highlighted on the daily chart.
Meanwhile, a successful breakout above $875.00 would turn attention to the 61.8% and 78.6% Fibonacci Extension (FE) levels of BNB’s June–August rally, positioned around $915.00 and $972.00 in that order, before targeting higher levels outlined on the daily chart.
Conclusion
Binance Coin’s inability to break immediate resistance levels, despite hitting a fresh ATH, aligns with pullback signals from the DMI on the four-hour chart to support the case for near-term consolidation. Still, the broader bullish channel and sustained price action above key EMAs keep BNB buyers optimistic for a gradual move higher towards refreshing record tops.
Also read: Is it time to accumulate BTC? Crypto Analyst Eyes Opportunity in Current Sell-off!


