- Ripple price follows broad crypto market optimism to extend recovery from 10-week low.
- RSI, MACD signal further XRP upside but 200-day SMA, multi-month resistance line challenge bulls.
- XRP rebound remains elusive below $2.66, bullish exhaustion may slow the advances.
Ripple (XRP) is holding firm around $2.20 during Tuesday’s European session, extending Monday’s powerful rebound—the biggest daily jump in over six weeks. The rally was fueled by improved crypto market sentiment after news of a ceasefire between Israel and Iran lifted investor confidence.
That said, XRP’s technical setup is also turning positive. The 14-day Relative Strength Index (RSI) is climbing back from near-oversold levels, while the Moving Average Convergence Divergence (MACD) is on the verge of a bullish crossover, hinting at further recovery.
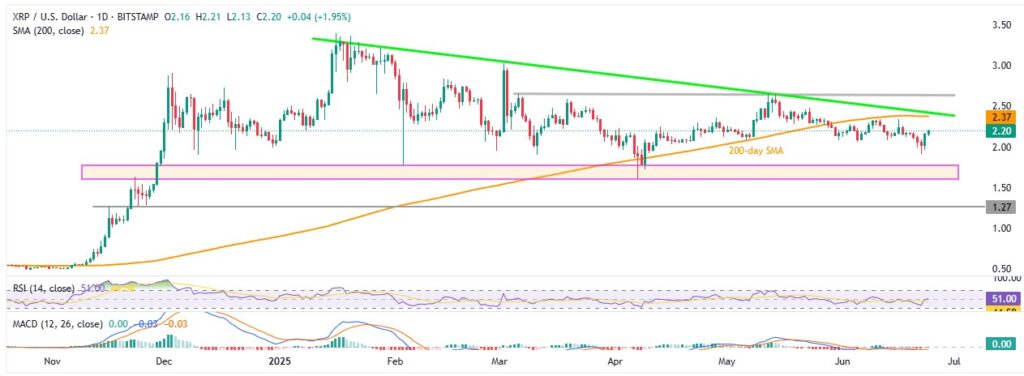
Still, the bulls aren’t in the clear yet. XRP/USD continues to trade below the 200-day SMA, a descending trendline resistance in place for five months and a horizontal hurdle that’s been holding since early March.
XRP/USD: Daily chart signals limited room for recovery

Source: Tradingview
Despite improving market sentiment, a rebounding RSI, and bullish signals from the MACD, Ripple’s recovery still has work to do. To truly convince buyers, XRP/USD must break above the 200-day SMA, currently at $2.37.
Even if that hurdle is cleared, more resistance lies ahead. A falling trendline from mid-January around $2.45, and a strong horizontal barrier between $2.65 and $2.66—unchallenged for 15 weeks—remain key obstacles for the XRP/USD bulls. Only a clean break above these zones would open the path toward the $3.00 mark and the yearly high of $3.40.
On the flip side, Ripple sellers are up against a solid support zone between $1.77 and $1.61, formed over the past seven months. Below that, horizontal support near $1.27, last tested in November 2024, acts as a crucial line of defense. If this level breaks, XRP could slide toward the psychological $1.00 mark, setting the stage for a deeper correction.
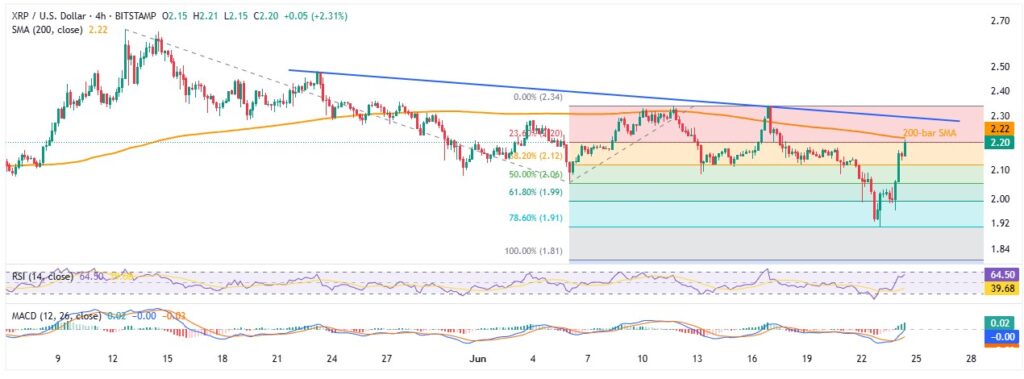
XRP/USD: Four-Hour chart signals immediate challenge for bulls

Source: Tradingview
On the four-hour chart, Ripple is bouncing off the 78.6% Fibonacci Extension (FE) of the May–June move, near $1.91. This recovery is backed by a rising RSI coming from oversold territory and strengthening bullish signals from the MACD—hinting that XRP/USD could soon challenge the 200-bar SMA near $2.22.
Still, buyers face serious tests. A descending trendline from early May, currently near $2.30, stands in the way, followed closely by a potential “Double Top” zone around $2.34. These barriers must be cleared before the bulls can aim for the resistance levels outlined on the daily chart.
On the downside, a decisive drop below $1.91 would hand control back to the bears, exposing the 100% Fibonacci Extension at $1.81. If that level gives way, attention will turn to deeper daily chart supports. In the short term, however, the 50% and 61.8% Fib levels at $2.06 and $1.99 act as buffers against further downside.
To sum up, XRP’s latest bounce challenges the bearish tone—but the bulls remain on shaky ground unless price breaks convincingly above $2.66. That said, the recovery may be alive, but the broader downtrend still looms in the background.


