Key Takeaways
- BNB price action suggests the asset could reach $900 if it clears the $866 mark.
- BNB network activity has outperformed Bitcoin, Ethereum, and Base in terms of active addresses.
- Coinglass data reveals that $3.09 million worth of BNB has left exchanges, indicating potential accumulation by investors.
For the third straight day, Binance’s native token BNB has continued its consolidation. However, things have shifted slightly, and the asset is now inching closer to turning its momentum to the upside.
The potential reason behind this optimistic shift in BNB is its bullish price action, strong on-chain metrics, and a surge in network activity.
BNB Price and Rising Trading Volume
At press time, BNB is priced at $863.50, marking a decent 0.35% climb over the past 24 hours. This modest surge has also triggered a spike in trading and investing activity.
CoinMarketCap data reveals that BNB’s trading volume during the same period has soared by 30% compared to the previous day. This surge in the trading volume, along with BNB’s decent performance, hints at a potential upside move in the asset.
BNB Network Outperformed Bitcoin and Ethereum
Recently, a well-followed crypto expert shared a post on X, noting that since April 2025, the number of active addresses on the BNB network has more than doubled.
Today, it ranges between 2 million and 2.5 million active addresses, surpassing top chains like Ethereum, Bitcoin, and Base. In addition, during the same period, the number of transactions has nearly tripled and is currently hovering between 10 million and 14 million, with a low transaction failure rate.
This surge in activity has also fueled a significant rise in the asset’s price. According to TradingView data, BNB has soared by over 45% since April 2025.
While the price has traded sideways over the past few days, it has now formed a bullish pattern, hinting that the upside momentum may continue.
BNB Coin Technical Analysis and Key Levels
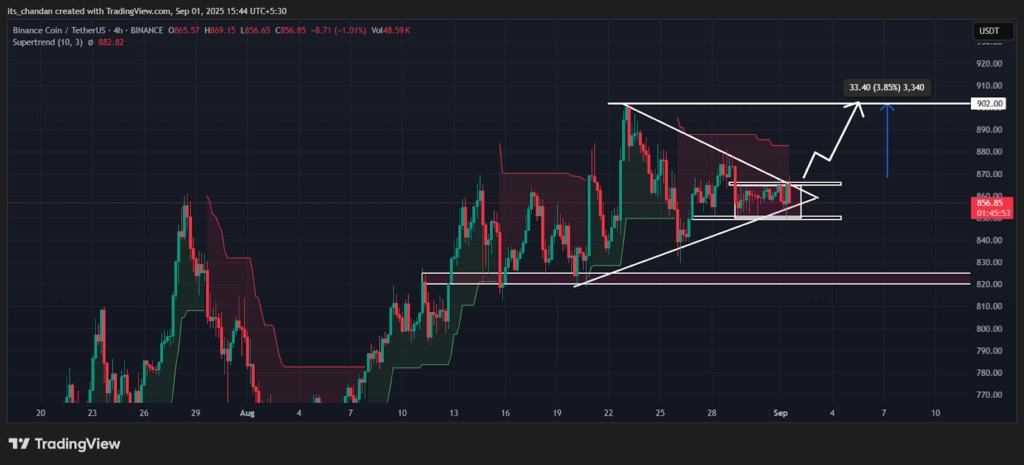
According to TimesCrypto’s technical analysis, a symmetrical triangle pattern was highlighted on the four-hour chart, indicating a possible breakout. Historically, the $866 level has acted as a strong area of selling pressure, which BNB is currently facing.

BNBUSDT Four-Hour Chart, Source: TradingView
Given the current market sentiment, if BNB clears the $866 level and closes a four-hour candle above $870, it could pave the way for a move toward $900 or even higher in the coming days.
So far, the Supertrend indicator remains in red and hovers above BNB’s price, suggesting that the asset is still in a downtrend.
$3 Million BNB Outflows Signal Accumulation
In addition to BNB’s price action, on-chain analytics firm Coinglass reveals that investors and long-term holders are continuously accumulating tokens.
According to spot inflow/outflow metrics, over $3.09 million worth of BNB has flowed out of exchanges in the past 24 hours.

BNB Spot Inflow/Outflow, Source: Coinglass
The substantial outflow signals potential accumulation and has been consistently recorded for three continuous days.


