Key Takeaways
- Sui’s TVL has smashed an all-time high of $885.59 million, reflecting strong user growth and confidence.
- The latest price action shows that SUI has formed a bullish pattern and has the potential to soar by 25%.
- Derivative data reveals that $2.507 remains a strong resistance level for SUI, which needs to be cleared for upward momentum.
Sui’s DeFi ecosystem is heating up as the network’s Total Value Locked (TVL) reaches an all-time high, even as the broader crypto market struggles. According to an on-chain analytics tool, Sui’s TVL has surged to a record $885.59 million, reflecting strong user growth and liquidity inflows, while raising questions about how this fundamental strength could impact the network’s native token, SUI.
SUI Holds Ground, Analysts See Upside Potential
Currently, SUI appears neutral and has been moving sideways over the past few days, but has formed a bullish price pattern, hinting that a rally could be on the horizon. According to the latest data from TradingView, SUI is trading at $2.42, marking a 1.65% price increase.
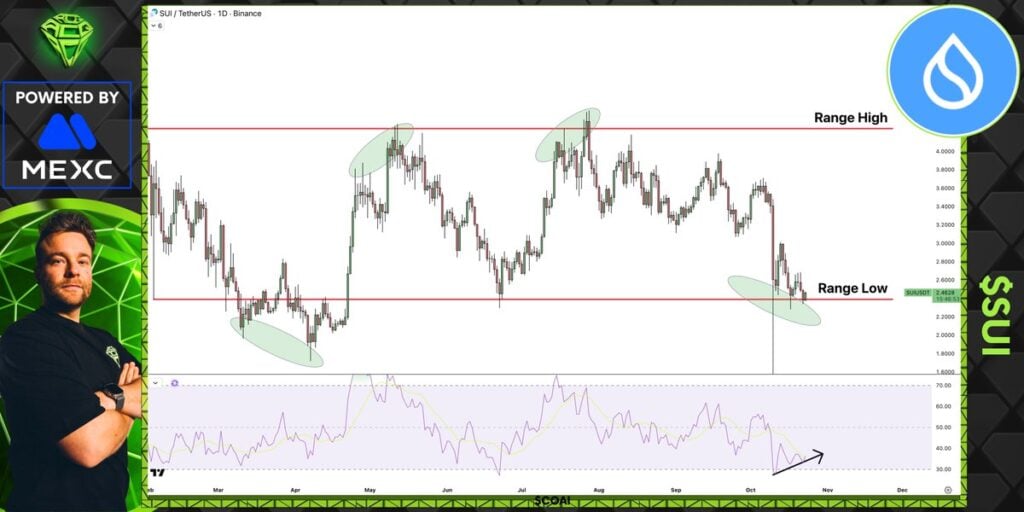
Meanwhile, analyzing the current market and SUI’s recent price action, a crypto expert shared a post on X noting that SUI looks promising with a clear bullish divergence.
This indicates that despite the price forming lower lows, the momentum indicator is making higher highs, a bullish signal suggesting that upward momentum may be building.

The expert shared a SUI chart highlighting several past divergences where the price moved accordingly and mentioned that a similar move could be expected this time as well.
Technical Outlook: Key Levels to Watch
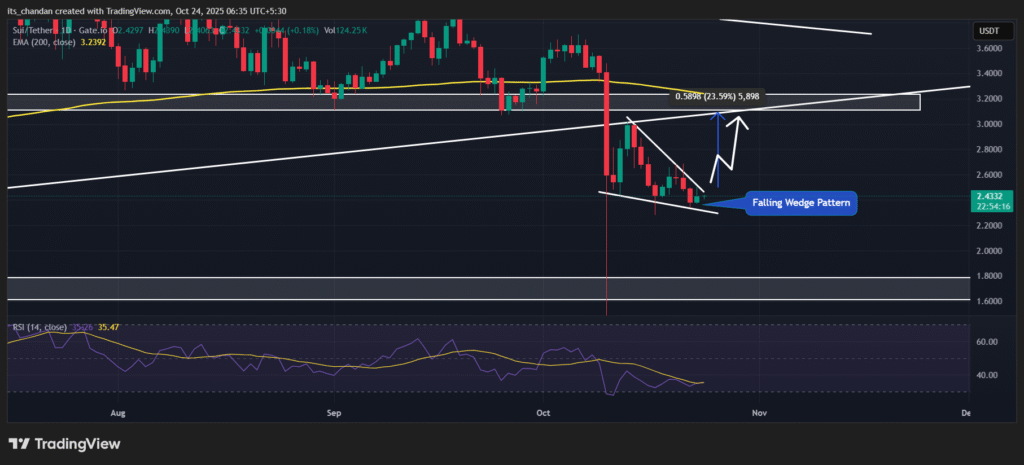
Besides this, TimesCrypto’s technical analysis reveals that SUI is currently in a downtrend as it hovers below the 200-day Exponential Moving Average (EMA) on the daily chart. Despite the downtrend, the asset has formed a bullish falling wedge pattern and is on the verge of a breakout.

If SUI’s upside momentum continues and it breaks out of the pattern, the price could see an uptick of over 25% and potentially reach the $3.10 level. However, if it fails to break out, there is also a possibility that the price could either move sideways or drop to the next support level at $1.80.
At press time, the technical indicator Relative Strength Index (RSI) is at 34.96, indicating that the asset is nearing oversold territory and may see a potential price reversal.
SUI’s Major Liquidation Levels
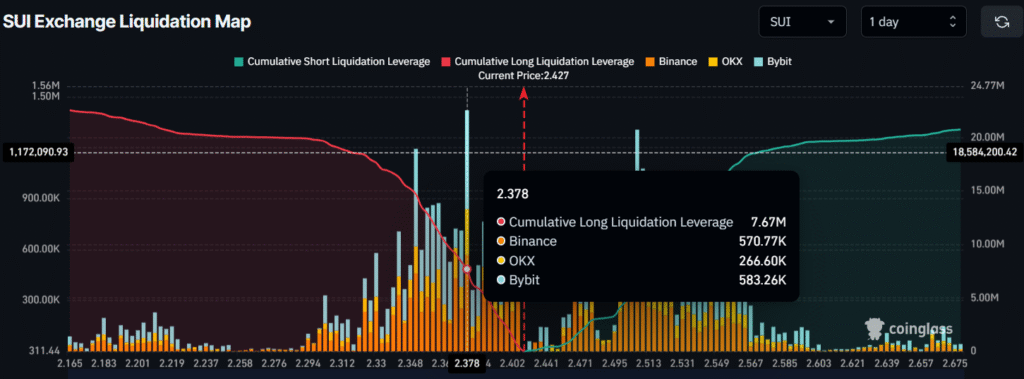
At the current momentum, the derivatives platform Coinglass reveals that traders betting long and short are in strong competition. According to the latest data, SUI’s major liquidation levels stand at $2.378 on the lower side, where higher interest is recorded, and $2.507 on the upper side, where slightly lower interest is noted.

The derivatives tool reveals that at these levels, traders have built $7.67 million worth of long positions and $6.98 million worth of short positions.
This makes it clear that bulls are still stronger than bears, but $2.507 remains a strong resistance for SUI. For the upward momentum to continue, the asset needs to clear this level.


