Key Takeaways
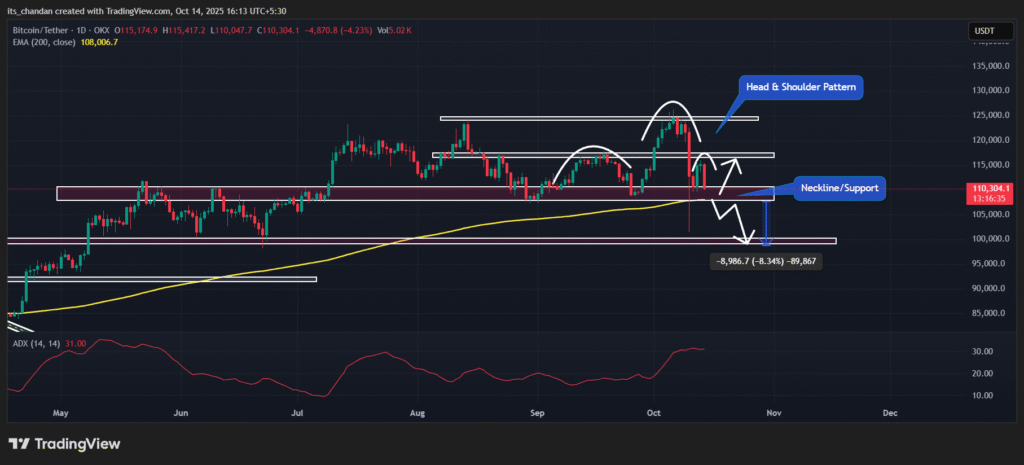
- The Bitcoin daily chart shows a bearish Head and Shoulders pattern; a breakdown of the neckline could push BTC down to the $100,000 level.
- Bitcoin’s downward momentum is driven by price action and potential sell-offs by institutions and the government.
- Bitcoin’s social volume has dropped to its lowest level since the beginning of 2025.
Following Friday’s brutal crash, Bitcoin (BTC) nearly recovered, but today it’s bleeding once again, posting a 4.35% dip according to TradingView data. The price decline isn’t the main concern; rather, it’s helping the BTC form a bearish setup that hints another crash could be on the horizon.
Bitcoin (BTC) Price Extends Decline
Today, with a notable 4.35% price dip, Bitcoin has reached the $110,200 level, a level near the key support of $108,800, which has been holding since early July 2025. Considering the price drop and current sentiment, market participants appear hesitant, as reflected in the trading volume, which has declined by 20% to $76.69 billion.
Why is Bitcoin Price Falling?
You might be wondering what’s causing Bitcoin’s price to bleed after its recent recovery. The key factors include the formation of a bearish price action pattern, whales opening large multi-million-dollar short positions, and the recent BTC sell-offs by the U.S. government, BlackRock, and Binance.
Also Read: Will Bitcoin Price Crash Again? Whales Place Millions in BTC Shorts
Bitcoin Technical Outlook: Chart Flashes Warning
According to TimesCrypto technical analysis, Bitcoin’s daily chart appears to be forming a textbook bearish Head and Shoulders pattern and is approaching the neckline at the $108,800 level. Additionally, the daily chart is showing the formation of a bearish evening star candlestick pattern at the neckline, further reinforcing Bitcoin’s bearish outlook.

Based on the current market sentiment, if the downward momentum continues and Bitcoin fails to hold its key support at the $108,800 level, it could see a decline of over 8.40%, potentially reaching the $100,000 mark.
However, in addition to horizontal support, Bitcoin is also receiving support from the 200-day Exponential Moving Average (EMA) on the daily chart, which may help limit its downside momentum.
As of now, Bitcoin’s Average Directional Index (ADX) has reached 31, above the threshold level of 25, indicating strong directional momentum, with the asset currently in a downtrend.
Institutional and Government Activity
Another key catalyst triggering Bitcoin’s price decline is the potential selloff by institutions and governments.
A well-followed crypto expert revealed that asset management giant BlackRock dumped $957 million worth of BTC in the last 12 hours. The expert further noted that it is a deliberate manipulation, continuously liquidating long positions.
The same expert recently reported that, along with BlackRock, the U.S. government also sold 667 BTC, valued at $75 million, in recent hours.
In addition to BlackRock and the U.S. government, the world’s largest crypto exchange, Binance, is also continuously selling BTC, as reported by a crypto expert. These sell-offs by institutions and the government appear to be a form of market manipulation ahead of the FED speech.
Looking at the current market scenario, an expert shared that social sentiment around Bitcoin has dropped to its lowest level in a year following Friday’s market crash, which appears to be a bearish signal for BTC holders.
Also Read: Will Bitcoin Price Crash Again? Whales Place Millions in BTC Shorts


