Key Takeaways:
- Bitcoin dropped sharply to $98,000 amid geopolitical tensions but rebounded above $101,000, with the pullback largely attributed to profit-taking and a broader risk-off shift following U.S. military strikes in the Middle East.
- Despite the volatility, fundamentals remain solid: Digital asset investment products recorded $1.24 billion in weekly inflows, bringing year-to-date totals to a record $15.1 billion and signaling continued institutional confidence.
- Glassnode data shows that on-chain activity has slowed, with large transactions and off-chain trading now dominating Bitcoin market dynamics.
- Chart indicators show early signs of market stabilization, with slowing bearish momentum on the daily timeframe and a modest short-term recovery on the hourly chart, though resistance levels remain unbroken.
- Further geopolitical escalation, particularly involving the United States, may pressure Bitcoin, as investors potentially rotate toward traditional safe havens like gold in response to rising uncertainty.
Bitcoin Slips from Highs, But Inflows Stay Intact
Bitcoin retreated from recent highs near $106,000, plunging to $98,000 on Sunday night before rebounding to around $101,900 by Monday morning, as rising geopolitical tensions and risk-off sentiment triggered a sharp selloff.
The decline followed reports of U.S. military strikes on Iranian targets, prompting a brief wave of market-wide panic.
Despite the volatility, on-chain data suggests the impact was largely surface-level, with key indicators pointing to continued accumulation by long-term holders.
Price Drop Driven by Risk Aversion Amid U.S. Strikes
The decline follows a period of strong gains, with BTC reaching new highs over the last couple of weeks. While some profit-taking likely played a role, the sharp pullback was primarily triggered by renewed risk-off sentiment after reports of U.S. military strikes on Iranian targets. The escalation heightened tensions in the Middle East and prompted a flight to traditional safe-haven assets such as gold.
Bitcoin had traded in a relatively stable range between $104,000 and $110,000 in recent weeks, even as clashes between Iran and Israel continued.
However, signs of a wider conflict potentially involving the United States or its allies appeared to shift sentiment. The prospect of broader geopolitical fallout prompted a move into assets such as gold.
At the structural level, underlying fundamentals remained intact.
Despite the dip in Bitcoin’s price, digital asset investment products recorded $1.24 billion in inflows last week, marking the tenth consecutive week of net gains, according to CoinShares.
Year-to-date inflows reached a record $15.1 billion, underscoring strong investor demand, with Bitcoin products accounting for $1.1 billion, while Ethereum funds attracted $124 million.
Additionally, total assets under management in crypto investment vehicles remain close to $167 billion, reflecting continued institutional interest.
BTC Blockchain Goes Quiet Despite Inflows
On June 19, 2025, Glassnode published a report titled An On-chain Ghost Town, highlighting a noticeable slowdown in Bitcoin network activity, despite continued inflows into digital asset investment products.
In the report, Glassnode notes that daily transaction counts have fallen significantly in 2025, now ranging between 320,000 and 500,000, well below the 734,000 peak recorded in 2024. The decline is largely attributed to a drop in non-monetary transactions, including activity linked to inscriptions and runes.
While the number of transactions on the Bitcoin network has declined, the value per transaction has increased significantly, now averaging $36,200. This trend has kept overall settlement volumes elevated, with the network processing an average of $7.5 billion per day and reaching a peak of $16 billion during the $100,000 all-time high in November last year.
Notably, large transactions over $100,000 now account for 89% of total volume, up from 66% in late 2022. This growing share suggests that on-chain activity is being increasingly dominated by institutional investors and high-net-worth entities, rather than retail market participants.
The findings suggest that while Bitcoin’s price remains elevated, much of the ecosystem’s momentum has migrated off-chain, reflecting a broader transition in how the asset is traded and held.
What Does the Chart Tell Us?
On the 1D Chart: Signs of Exhaustion Are Showing Amid Persistent Pressure
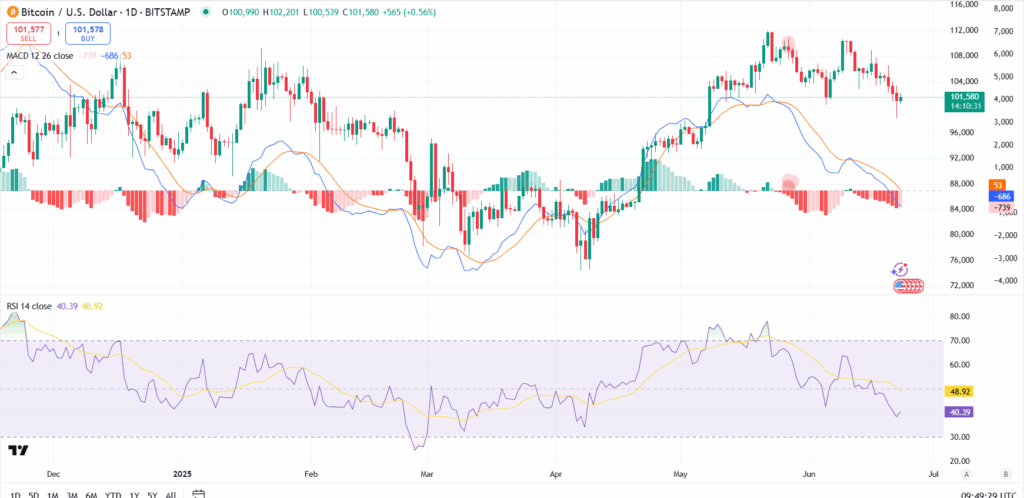
Bitcoin’s daily chart reflects a market in retreat, but not collapse. After dropping to $98,000, the price has stabilized just above $101,000. While the rebound offers short-term relief, indicators suggest that broader pressure persists.
The MACD remains below the zero line, with extended red histogram bars, indicating sustained bearish momentum. Although the downtrend has slowed, no clear reversal signal has emerged. The Relative Strength Index (RSI) stands at 40.39—near oversold territory—suggesting potential selling exhaustion, though confirmation remains elusive.
Price action continues to trade below key moving averages, including the 21- and 50-day lines, keeping the trend biased to the downside. However, the decelerating pace of the decline may signal the start of a consolidation phase, where market direction is reassessed.
A close above the $104,000–$105,000 range would be required to shift medium-term sentiment back toward bullish territory.

On the 1H Chart: Momentum Slows After Sharp Recovery
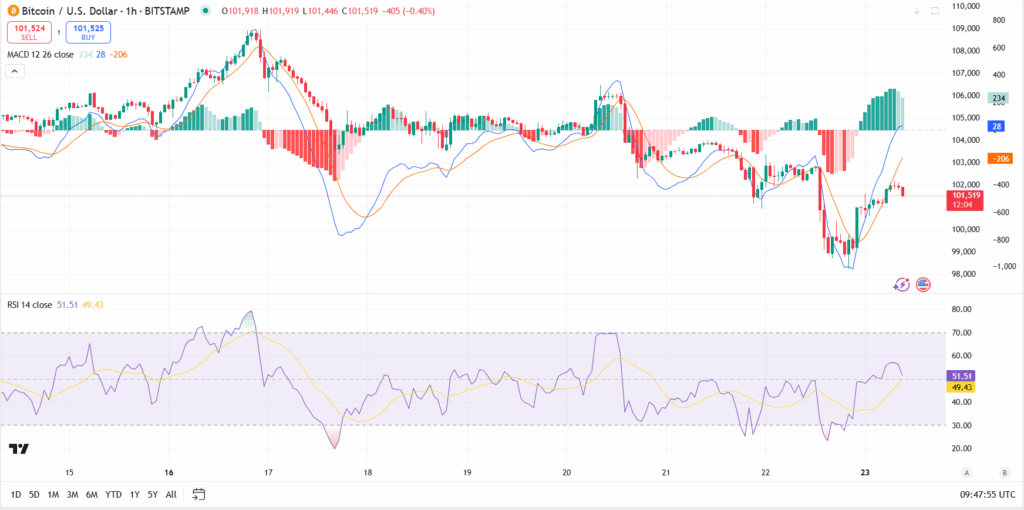
On the hourly chart, Bitcoin’s recovery, which appears to be losing momentum, is more immediately evident. After a sharp selloff to $98,000, Bitcoin swiftly rebounded, reaching intraday highs near $102,000 before its upward movement stalled.
A MACD crossover confirmed short-term bullish momentum, but the histogram has begun to flatten, pointing to a possible pause in buying strength. The RSI has risen to 51.51, a neutral zone that reflects neither strong upward nor downward bias.
Price action suggests indecision. Bitcoin is struggling to break through the $102,000 mark and remains confined within a tight range. Without further buying interest, the rally risks fading. A break above $102,500 could open the door to additional upside, while failure to hold current levels may signal that the recovery was short-lived.

Market Wrap-Up: On-Chain Data Supports Stabilization Narrative
Bitcoin’s recent price decline, while sharp, appears to have had a limited structural impact, as investment flows and technical indicators suggest conditions may be stabilizing.
Digital asset investment products saw $1.24 billion in inflows last week, extending a ten-week streak and bringing year-to-date totals to a record $15.1 billion.
Chart signals remain mixed. On the daily timeframe, momentum has slowed, and RSI is nearing oversold territory, indicating potential for consolidation. The hourly chart shows a modest rebound from recent lows, though price action has struggled to break key resistance levels.
At the same time, new on-chain data from Glassnode reveals that while overall transaction activity has declined, the value transferred on-chain remains high. Large-value transactions now account for the vast majority of network volume, suggesting that institutional and high-net-worth investors are increasingly driving on-chain behavior.
While technical and flow-based indicators point to underlying support, the outlook remains sensitive to geopolitical developments. Any escalation in regional conflict, particularly involving direct United States engagement, could lead investors to retreat from risk assets like Bitcoin and move toward traditional safe havens such as gold.
Read More: Market Digest: U.S. Strikes Iran, Bitcoin Rebounds Near $100K, Gold and Oil Stay Strong


