Key Takeaways
- Solana (SOL) price struggles again as Galaxy Digital dumps 250,000 SOL worth $51.69 million to Binance.
- Price action suggests that SOL could continue its downward momentum if it fails to reclaim the $209 level.
- Derivative data from Coinglass reveals that traders’ bets on short positions have intensified, now more than double the long positions.
Solana (SOL), the world’s sixth-largest cryptocurrency with a market cap of $111 billion, is once again under pressure after Galaxy Digital dumped millions of dollars worth of SOL. According to a recent update from the crypto transaction tracker Lookonchain, Galaxy Digital has deposited 250,000 SOL worth $51.69 million to Binance.
Galaxy Digital Dump Millions Worth of SOL
Before Galaxy Digital dumped a massive $51.69 million worth of SOL, Lookonchain revealed during the Asian trading session that Forward Industries deposited 993,058 SOL worth $192.08 million to Coinbase Prime and 250,000 SOL to Galaxy Digital, which was later deposited to Binance.
For context, Galaxy Digital is one of the key financial supporters behind Forward Industries’ massive Solana treasury, along with Jump Crypto and Multicoin Capital. In September 2025, these firms collectively raised $1.65 billion through a private investment in public equity (PIPE) to purchase 6.82 million SOL at an average price of $232.
However, it is not yet confirmed whether the firm is selling its recently accumulated SOL at a loss or if something else is going on. As of now, market sentiment remains weak, and the asset appears to be struggling to gain momentum.
Also Read: Ethereum Price News: ETH Trades below $4,200; Exit or Hold?
Solana (SOL) Current Price Momentum
As per the latest TradingView data, SOL is trading near $200, with a 1.25% price dip recorded today. However, derivative data from Coinglass reveals that market participants seem hesitant to engage, resulting in a 25% drop in trading volume to $30.51 billion.
Considering the current market sentiment, the recent transactions by Galaxy Digital and Forward Industries raise the question, What’s next for SOL? Whether the price will rise or continue to struggle.
Solana Technical Outlook: Key Levels to Watch
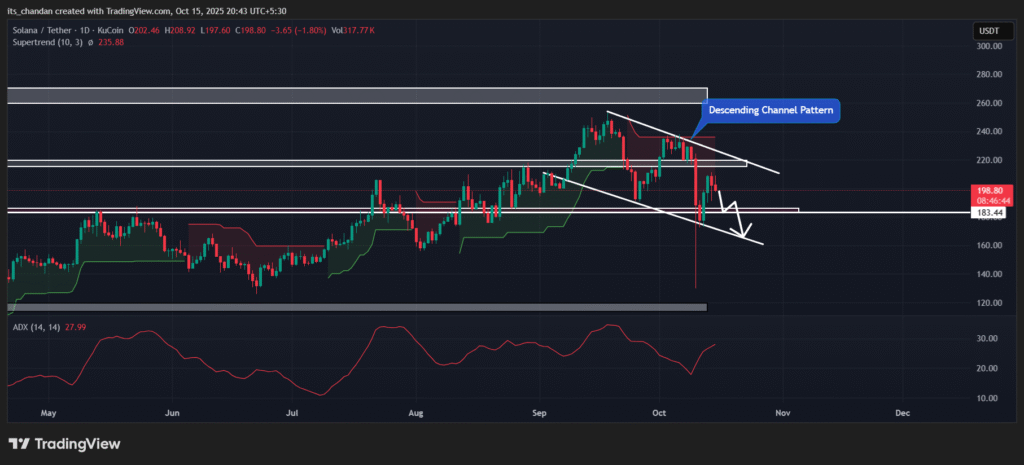
TimesCrypto’s technical analysis on the daily chart reveals that SOL is moving within a descending channel pattern between its upper and lower boundaries. Following the recent price recovery, the asset reached near the upper boundary, from where it has continued to decline.

Based on the current price action, if SOL fails to close a daily candle above the $209 level, it could continue its downward momentum and potentially fall toward the lower boundary of the descending pattern.
At press, both the Supertrend and Average Directional Index (ADX) indicators reinforce a bearish outlook. On the daily chart, the Supertrend remains red above the asset price, indicating that SOL is in a downtrend, while the ADX has reached 28, above the 25 threshold, signaling strong directional momentum.
Major Liquidation Levels
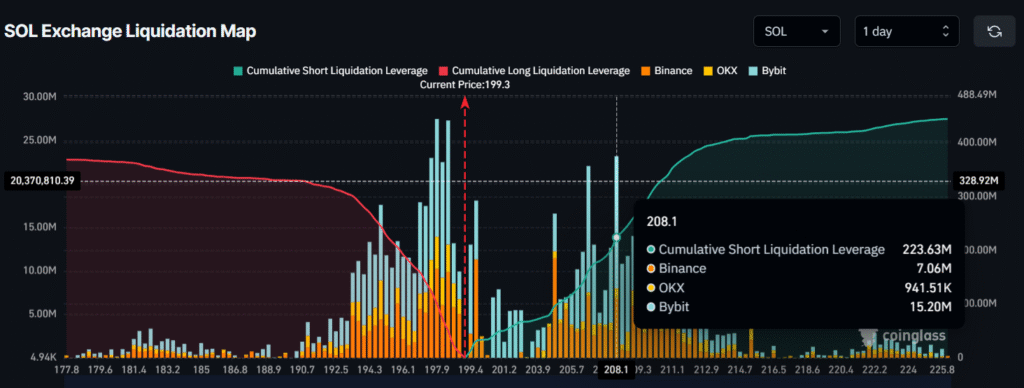
Meanwhile, derivative data from Coinglass also strengthens the bearish outlook, as traders’ bets on short positions continue to rise, nearly doubling those on long positions.
At press, SOL’s major liquidation levels stand at $197.9 on the lower side and $208.1 on the upper side, where strong trader interest has been recorded. At these levels, traders have built $100.50 million in long positions and $223.63 million in short positions.

This clarifies that bullish dominance has faded, and bears are currently controlling the asset, with a strong belief that SOL will not be able to cross the $208.1 level.


