Key Takeaways
- XLM’s month-long bearish trend has flipped bullish.
- Price action and technical analysis suggest that XLM is poised for another 13% jump.
- Investors and traders show mixed sentiment, with some taking profits while others are betting on long positions.
With the shift in market sentiment, Stellar (XLM) has flipped its prolonged bearish trend, signaling a potential reversal. This change has triggered an impressive price uptick in the asset, now attracting massive participation from crypto enthusiasts.
XLM Price Surges with Rising Volume
Today, September 9, 2025, XLM price jumped 4.5%, reaching the $0.383 level for the first time since August 2025. Meanwhile, its trading volume skyrocketed 60% compared to the previous day, which shows heightened participation from investors and traders.
This rising volume, along with the price increase, reflects strong interest in the upside and also highlights the asset’s strong uptrend.
On-Chain Data Shows Mixed Signals
Some investors appear to be seizing XLM’s gains for profit-taking, as they seem to be dumping their holdings.
According to on-chain analytics firm Coinglass, over the past 24 hours, more than $5.50 million worth of XLM tokens have moved into exchanges, signaling potential dumping. Such inflows typically reduce upside momentum.

Meanwhile, traders’ sentiment remains unchanged as they continue to follow the current trend.
Coinglass’s XLM Long/Short ratio crossed above 1, reaching 1.0342, signaling strong bullish sentiment among traders. This on-chain metric further reveals that the majority of positions are currently being built by long traders.

Experts Eye XLM’s Next Bullish Leg
Given the current market sentiment, a crypto expert noted that XLM’s price action mirrors its 2017 bullish pattern, suggesting a strong possibility that the asset is gearing up for the next leg up, something already evident in its price.
XLM Price Analysis: Key Levels to Watch Closely
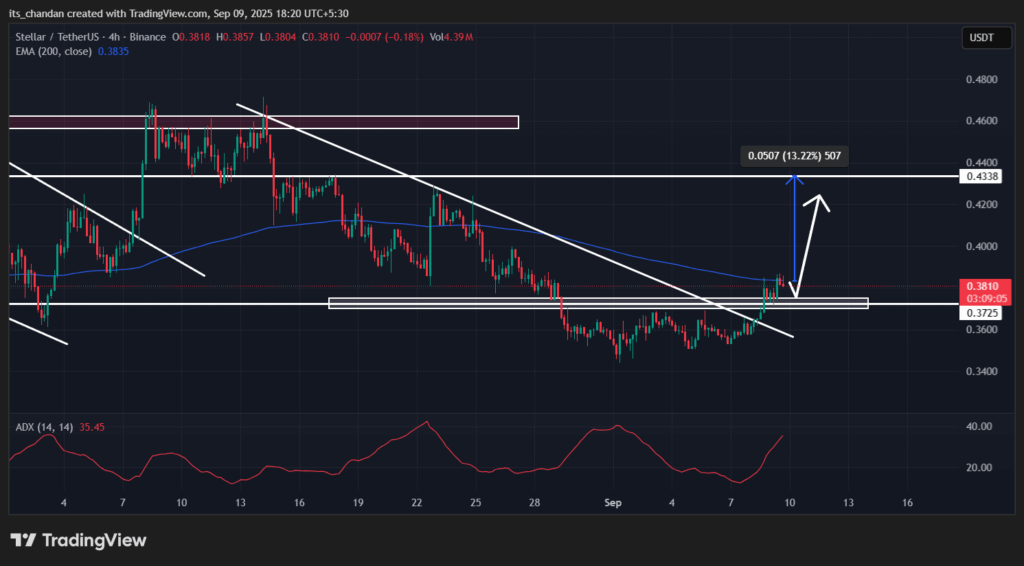
According to TimesCrypto’s technical analysis, XLM has turned bullish and is poised to continue its upside momentum. On the four-hour chart, the recent gains appear to have broken a prolonged descending trendline and the horizontal level of $0.372, which previously acted as strong resistance.

Since August 15, 2025, XLM faced multiple rejections at this level, but it has now been clearly broken.
Based on the current price action, if XLM sustains above the $0.372 level, it could see an impressive 13% uptick and potentially reach $0.433 or higher in the coming days.
Meanwhile, the technical indicator Average Directional Index (ADX) has reached 35.45, signaling a strong bullish trend.
In price action analysis, experts use this indicator to determine whether a breakout is a fakeout (if the ADX value is below 25) or real (if the ADX value is above 25). In this case, with the ADX over 35, it clearly signals a strong bullish trend.
Meanwhile, the asset appears to be facing resistance from the 200-day Exponential Moving Average (EMA), which is acting as a barrier to further rally. If this level is cleared, a quick rally could follow.


