Key Takeaways
- Pump.Fun (PUMP) $14.21 million token sell-off triggered a sharp decline.
- PUMP price action indicates the asset is in correction mode and may see another 10% dip in the coming days.
- The ADX value has reached 47, suggesting a strong directional trend for the token.
The profit-taking in Pump.Fun (PUMP) has intensified, resulting in a sharp dip in the asset recorded. On September 11, 2025, while the majority of cryptocurrencies, including Bitcoin (BTC) and Ethereum (ETH) are showing strength, PUMP has slipped by 3.56%.
Why is the Pump.Fun (PUMP) Price Falling?
This fall in the PUMP price follows millions worth of PUMP being dumped on the exchanges. Coinglass, an on-chain analytics tool, reveals that a massive $14.21 million worth of PUMP has moved onto the exchanges over the past 24 hours.

This inflow of PUMP onto exchanges hints suggests a large-scale sell-off by investors and long-term holders and is recorded as the largest since July 22, 2025.
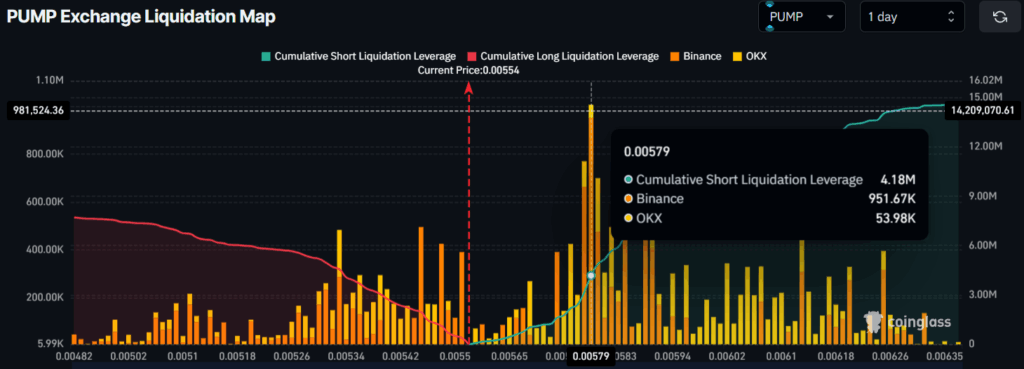
As a result, traders’ sentiment has turned bearish. Coinglass data shows that PUMP’s major liquidation levels are at $0.00533 on the lower side and $0.00579 on the upper side, where traders’ interest has intensified.

Meanwhile, traders at these levels have built $2.36 million worth of long positions and $4.18 million worth of short positions.
This shows that traders strongly believe the PUMP price is unlikely to cross the $0.00579 level anytime soon.
Current Price Momentum
At press, PUMP is trading at the $0.00557 level, marking a downside movement of over 3.56% in the past 24 hours. Meanwhile, the asset’s trading volume during this period has jumped 75% compared to the previous day.
This indicates strong participant interest in the downside momentum, which appears to be a bearish signal for the asset’s price.
All of this was recorded after the PUMP price rallied over 150% in the past two weeks, which now appears to be cooling off.
Price Action and Technical Analysis
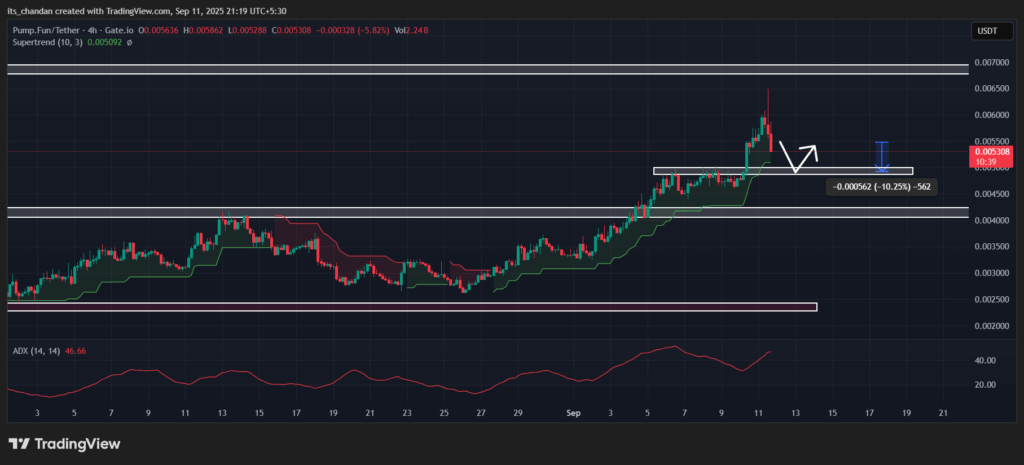
TimesCrypto’s technical analysis reveals that PUMP is in an uptrend, but due to a parabolic move in the past few days without any pause, the asset is undergoing a correction.
On the four-hour chart, PUMP has formed a bearish hammer candlestick pattern along with supportive red candles near the key resistance level of $0.0068, raising the likelihood of further downside momentum.

Based on the current price action, if this sell-off continues, there is a strong possibility that the asset could see a further price dip of 10% and may reach the next support at the $0.0050 level. However, a reversal would only be possible if the PUMP price sustains above the $0.0050 level; otherwise, the downward movement may continue.
Despite all these sell-offs, PUMP’s technical indicator, Supertrend, is still in green and hovering above the asset price. This indicates that the asset remains in an uptrend, suggesting bullish momentum may continue as long as the indicator holds.
On the other hand, the Average Directional Index (ADX) has reached 47, above the threshold of 25, indicating a strong directional trend that reinforces PUMP’s bearish outlook.


