Key Notes
- Ethereum’s futures premium dropped from over 20% to around 4–5%, clearing sell-side pressure.
- ETH On-chain activity, such that active addresses and DeFi usage remain strong.
- The second-largest cryptocurrency faces net inflationary pressure.
Why Was Ethereum Under Pressure?
Late last year, Ethereum (ETH) futures on the CME exchange created an unusual situation. Futures prices surged dramatically, trading at a premium (over 20% higher than ETH’s spot price). In simple terms, futures prices jumped because demand for ETH futures temporarily outpaced spot demand, pushing futures artificially higher. Institutional traders took advantage of the situation:
- Step 1: They bought actual ETH on the spot market.
- Step 2: Simultaneously, they sold ETH futures at the inflated prices.
These traders didn’t dislike ETH, they simply exploited the price gap for guaranteed profits through “arbitrage.”
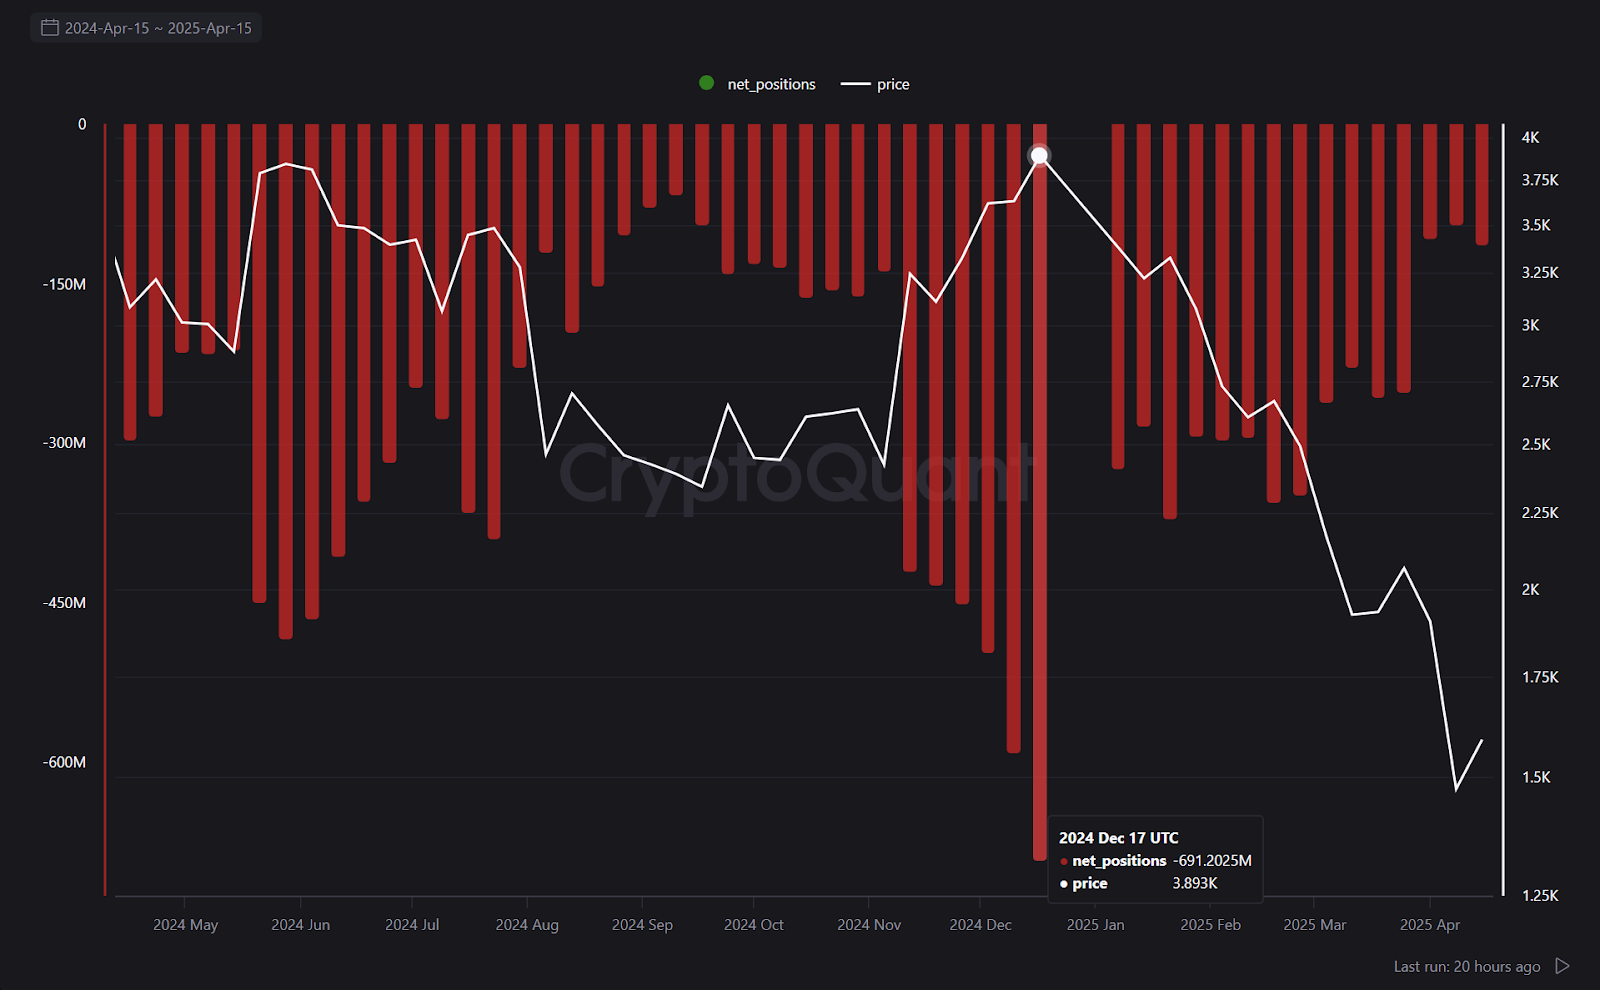
Source: CryptoQuant
How Did This Impact Ethereum’s Price?
Initially, the arbitrage strategy didn’t hurt ETH’s price. However, when traders closed their positions by selling their spot ETH and covering their futures shorts, they created significant downward pressure.
This pressure contributed to ETH’s sluggish price movement early in 2025, despite good overall market conditions.
What’s Changing Now?
The good news is: most of these arbitrage trades have ended. The futures market premium has shrunk from over 20% to just around 4-5%, removing a major weight from ETH’s shoulders.
The $600 million-plus short positions that were built up are now mostly gone. This clears the way for ETH to react positively if new buying interest returns.
Is This Bullish for Ethereum?
Clearing out short positions doesn’t guarantee a price surge. However, it makes Ethereum’s price more sensitive to positive market developments.
Inflation Outlook & On-Chain Metrics: Ethereum creates new ETH through block and staking rewards faster than fees are burned, causing net inflation that can pressure prices.
However, key on-chain data remains strong:
Monthly Active Addresses: Rose from 6.2 million in Q3 24 to 7.1 million in Q1 25, showing growing user activity.
Q1 Network Fees: ETH Dapps generated over $1 billion in fees, much of which helps burn supply.
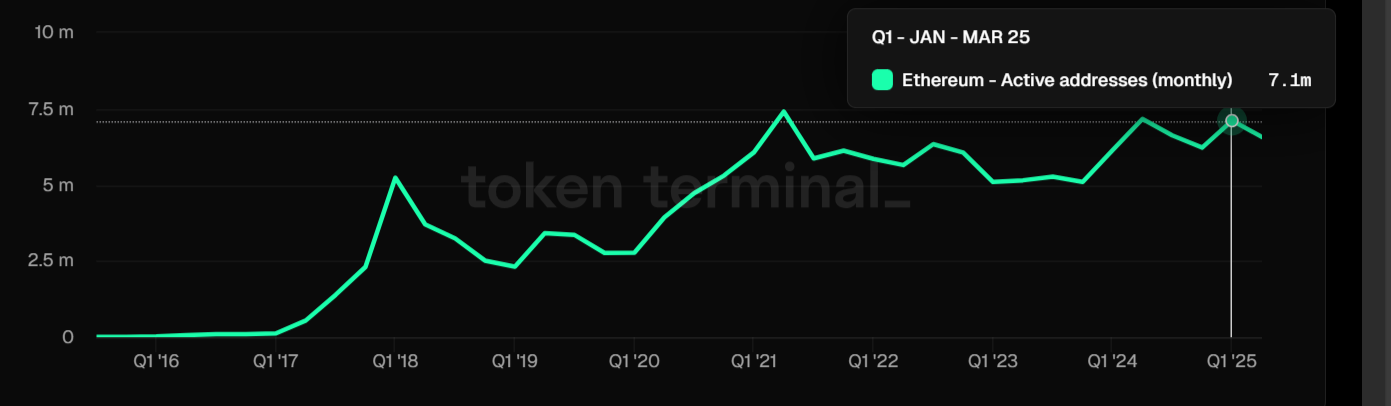
Source: TokenTerminal
With structural hurdles removed, ETH’s price is more likely to react positively to upcoming bullish developments.
Technically speaking, the daily chart shows the bearish trend in the second-largest cryptocurrency. The bearish trend line that extends from the high of $4,017 acts as the upside filter for the price. For the past few sessions, the ETH price has traded in a range of $1,500 and $1,600. A strong resistance is playing around the $1,700 mark.
Technical Chart Shows ETH Short-Term Downtrend

source: Trading view
A daily close above the high made on April 14 at $1,690 could be the pivot point to continue the bullish momentum. Further, a bullish sentiment in the market could push the price toward the high of $2,097 made on March 25.
On the other hand, a close below the $1,540 support level could dent the bullish momentum. The Relative Strength Index (RSI) trades below 50, signalling the prevailing bearish sentiment.
In a nutshell, the Ethereum price isn’t guaranteed to rise immediately, but it’s certainly set the stage for a potential upside move. Traders and investors are advised to wait for the confirmation before any directional bet.