Bitcoin (BTC/USD) eases to around $107,800 after its biggest weekly jump in seven weeks, while Gold (XAU/USD) rebounds to $3,292 from key $3,250 support after a two-week slide.
Broad optimism in the market, supported by the Israel-Iran ceasefire, US President Donald Trump’s recent statements, and the Federal Reserve’s dovish bias, emerged as key drivers behind the latest rise in Bitcoin (BTC/USD) prices. Gold (XAU/USD), however, continued to face pressure from seasonal weakness and technical corrections, struggling to benefit from the generally positive market sentiment and a softer US Dollar.
The US Dollar Index (DXY) extended its losing streak for the eighth consecutive day, falling to its lowest level since February 2022. This decline was driven by easing geopolitical tensions in the Middle East, the Fed’s less hawkish tone, and Trump’s push for interest rate cuts. Last week’s US Core PCE Price Index came in stronger than expected, but weak consumer spending data and Fed Chair Powell’s emphasis on a “wait-and-see” approach weighed further on the dollar. This combination supported Bitcoin’s advance while capping Gold’s ability to recover.
Over the weekend, former President Donald Trump expressed confidence in strong US economic growth, which he believes will offset the expected rise in the federal deficit tied to his proposed “Big Beautiful Bill.” Posting on Truth Social, he urged fellow Republicans not to overdo spending cuts, saying, “We will make it all up, times 10, with GROWTH, more than ever before.” Lawmakers are under significant pressure to pass the bill before the July 4 holiday.
Trump also renewed his call for lower interest rates and suggested appointing a more dovish figure to replace current Fed Chair Jerome Powell. In a pre-recorded Fox News interview, Trump stated, “We’re going to get somebody into the Fed who’s going to be able to lower the rate.” These comments added further pressure on the US Dollar, helping Bitcoin (BTC/USD) stay supported and allowing Gold (XAU/USD) to rebound from a 5.5-month-old ascending trendline.
Meanwhile, Iran and Israel agreed to halt military attacks on each other, easing global supply chain tensions after US involvement. This calm boosted risk assets like Bitcoin (BTC).
At the same time, rising institutional interest—shown by increased activity in the US spot BTC ETF—and large whale purchases added strength to Bitcoin’s price.
Elsewhere, history repeated itself as Gold declined during the typical May-June period, especially pulling back from its all-time highs. Despite a weaker US Dollar and growing institutional demand, Gold struggled to rally. Recent reports show that Gold has become the second-largest reserve asset for global central banks, surpassing the Euro.
Technical Analysis
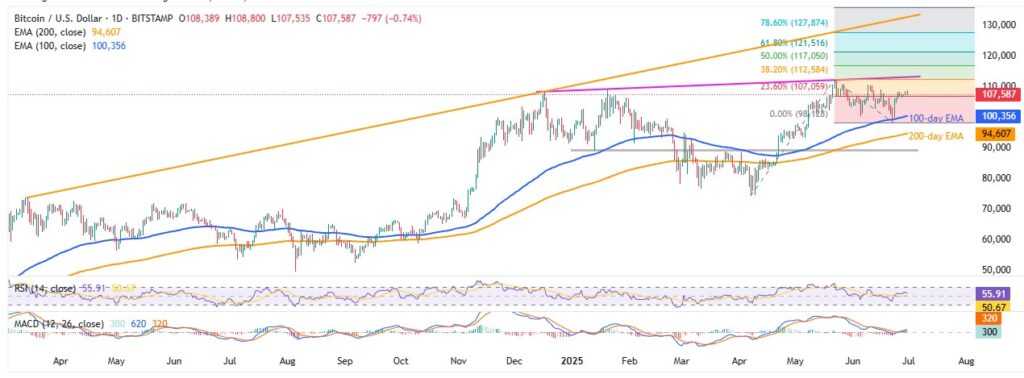
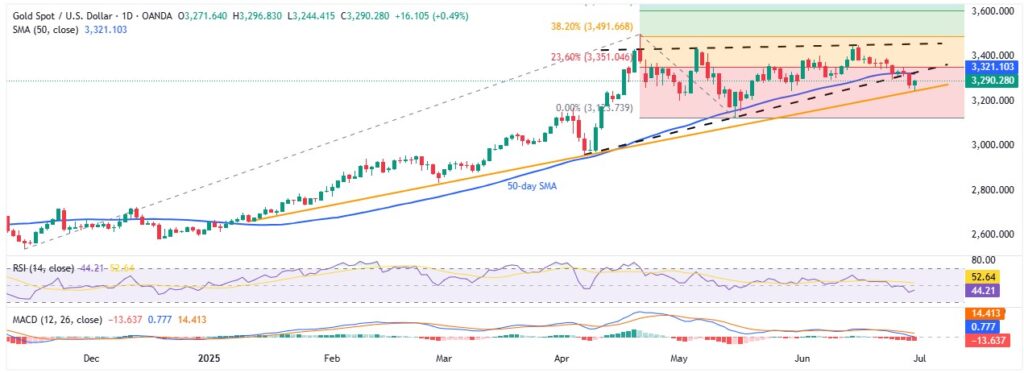
Bitcoin extends its recovery from the 100-day Exponential Moving Average (EMA) and approaches key multi-month resistance lines. This upward move is supported by an upbeat 14-day Relative Strength Index (RSI) and bullish momentum signals from the Moving Average Convergence Divergence (MACD) indicator. Meanwhile, Gold’s rebound from a 5.5-month-old ascending support line still requires confirmation by breaking through the $3,321 resistance confluence to convince buyers to step in.
BTC/USD: Daily Chart Favors Bulls

Source: TradingView
Bitcoin’s recovery from the 100-day EMA, currently near $100,360, combined with strong RSI and MACD signals, points to another attempt at breaking an upward-sloping resistance line from December 2024, close to $113,000 at press time.
Beyond that, the 38.2%, 50%, 61.8%, and 78.6% Fibonacci Extensions of the April-June rally may present further resistance levels for BTC/USD buyers before reaching a major 15.5-month-old rising trend line around $133,000.
However, if Bitcoin falls below the 100-day EMA support at $100,360 during a market correction, the 200-day EMA near $94,600 and a horizontal support zone from early January 2025 around $89,300 could act as strong defenses against further downside.
Gold: Bulls Need Validation from $3,321 on Daily Chart

Source: TradingView
Unlike Bitcoin, Gold’s recovery from an ascending support line starting in early January, currently near $3,245, needs confirmation by breaking through a key resistance area around $3,321. This resistance is formed by the convergence of the 50-day Simple Moving Average (SMA) and a previous support line dating back to early April.
The Relative Strength Index (RSI) remains below 50, and the MACD signals are bearish, indicating that Gold bulls face a challenging path to clear the $3,321 hurdle.
If Gold buyers succeed in crossing $3,321, the next targets would be the 10-week-old resistance near $3,450, followed by an attempt to challenge the all-time high at $3,500.
On the downside, a daily close below $3,245 could trigger a pullback toward May’s low of $3,120 and the critical $3,100 level, opening the door for bears to take control.
Conclusion
Market optimism fueled by Trump’s pro-growth and dovish Fed outlook, and easing geopolitical tensions continues to support Bitcoin’s steady recovery and bolster risk assets. Meanwhile, Gold faces headwinds from seasonal weakness and cautious market sentiment despite softer US Dollar and strong institutional demand. Traders will be watching this week’s Fed Chair Jerome Powell’s speech and US employment data, as well as the risk catalysts, closely as both assets navigate key resistance and support levels amid ongoing economic and political developments.


