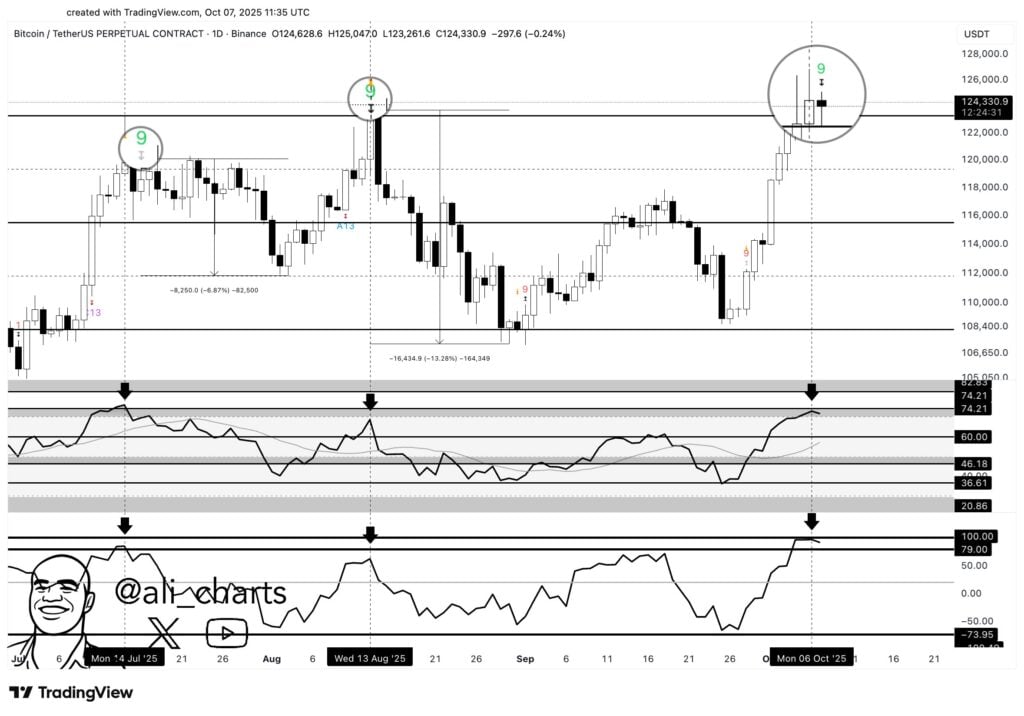
Crypto analyst Ali Martinez pointed out that Bitcoin is already beginning to show signs of exhaustion as its price recently surged beyond $125,000. He pointed to a formation of several technical red flags indicating that the price could soon experience some form of a correction.
Analyst Spotlights Red Flags On Bitcoin Price Chart
On the post X, Martinez referenced the TD Sequential indicator on the daily chart of Bitcoin, which has generated a new sell signal: a historical pattern followed by temporary pullbacks and then the overall trend continues. He wrote, “The TD Sequential indicator is flashing a sell signal on the daily chart, which typically suggests that a 1–4 daily candlestick correction may follow.” He noted that previous occurrences led to notable retracements.
The chart, which is provided by Martinez, presents Bitcoin with resistance around the level of $125,000, where a previous rally also peaked in mid-August 2025. A comparable TD Sequential signal was followed at that moment by a 13% decline, after a previous 7% correction, which commenced after a sell trigger in July. The most recent signal is found in the same overbought zone, raising the likelihood of another cooling period.

To defend this structure are two other indicators: the Relative Strength Index (RSI) and the Chande Momentum Oscillator (ChandeMO), both of which indicate stretched values. “RSI recently touched 74.21, within overbought territory (typically 70–80),” Martinez said. The level of the RSI reflects the levels of the past reversals as observed in the chart, where lines are used to indicate peaks that were followed by two short-term market tops.
At the same time, the ChandeMO, the indicator of the change of momentum, has already reached its maximum point of 100, the upper limit of its overbought band. Martinez emphasized that “each of the last two sell signals aligned with similar readings from these indicators and both led to significant pullbacks.”
This can be confirmed using the visual data: both in July and in August, RSI and ChandeMO surged during the same periods when TD Sequential 9-count signals surged, then both made significant declines of 6% to 13%. There are also horizontal levels of resistance on the chart in between the $122,000 and $125,000 price ranges, where the price action has stalled many times.
BTC Has 100 Days To Make It Or Break It
To further amplify the warning sound, a different trader by the name of Tony “The Bull” Severino posted a separate analysis of the volatility setup on Bitcoin. He pointed out that Bollinger Bands on the weekly timeframe, a volatility-based measure, have become tighter than ever before and indicated that a major movement could be approaching. The timing is, however, unclear. “According to past local consolidation ranges, it could take as long as 100+ days to get a valid breakout,” Severino observed.
He also stated that Bitcoin has not “failed to break out above the upper band with strength. The analyst advised traders of what to expect in a head fake, which refers to false breakouts that can ensnare both buyers and sellers.
“We might have seen one with this latest move,” he said, referencing Bitcoin’s recent push above $126,000. He added that another downward fake-out “before eventually taking off higher” was also possible.
Both analysts hint that there is a possibility of the Bitcoin current trend going dead, with historical data showing that it will be weakened in the short term before any decisive action is taken.
Also Read: Crypto Morning News: Bitcoin Holds at 123K as Gold Tops $4,000, Gaza Truce Lifts Global Mood


