Key Takeaways:
- Institutional demand for Bitcoin is 600% more than the daily supply, supported by ETF and Treasury purchases,
- The dominance of Bitcoin falls to 60% as investors interest inclined toward altcoins like Ethereum.
- Bitcoin on-chain activity declines while the price tests all-time highs.
Charles Edwards, the founder of Capriole Investments with over 100K followers on X and a pioneer in on-chain analytics, provided insights into the supply-demand dynamic in the industry. The ‘Hash Ribbons’ indicator was developed by fund manager and investor Edwards. The Hash Ribbon indicator gives a strong buy signal for BTC when it detects that struggling miners have recovered from a period of stress.
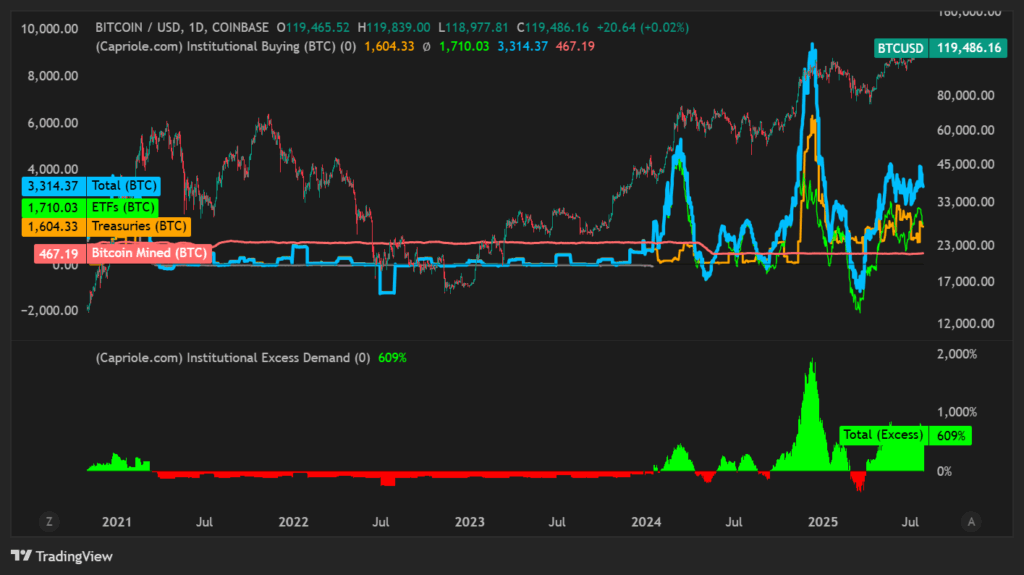
Edwards had recently tweeted that the institutional demand for Bitcoin (BTC) has increased to more than 600% in comparison to the new daily supply.
ETFs and treasuries together buy almost 3,300 BTC every day, but miners only produce 467 BTC, according to the graph displaying institutional demand.
Treasuries are adding 1,604.33 BTC every day, while ETFs are purchasing 1,710.03 BTC. The 3,314.37 BTC total institutional demand far exceeds the 467.19 BTC produced every day by miners.
According to the graph from Capriole, this discrepancy has led to an “excess demand” rate of 609%. When this much capital enters the market with little new supply, the strong institutional demand drives up prices.

Bitcoin Dominance Tells Another Story
Bitcoin dominance demonstrates the proportion of the whole cryptocurrency market that comprises Bitcoin relative to all other cryptocurrencies.
The dominance of the pioneer cryptocurrency has decreased from 64.9% last month to 60.0% today, suggesting that other cryptocurrencies, such as Ethereum, are capturing a greater portion of the market.

On-Chain Data Shows Growth Slowing
The latest on-chain data from Santiment reveals a concerning divergence between Bitcoin’s price and its network growth.
While BTC consolidates near its all-time highs, network growth measured by the number of new addresses sending BTC for the first time has dropped from highs of 340K to 275K. This implies that rather than new user adoption, the present rise is being driven more by speculative activity and current participants
. In the past, these discrepancies have frequently indicated waning momentum and possible price adjustments in the event that fresh demand does not emerge. This is a cooling indication underneath the surface that traders should keep a close eye on.
Even if BTC is trading close to its peak, the most recent transaction count data shows an apparent decrease in on-chain activity. This indicator provides information about actual user engagement by counting the number of distinct transactions that occur on the network each day.
Although transaction volume peaked in late 2024 and early 2025, usage has clearly declined and become more volatile in recent weeks. This could indicate a decline in network activity underneath the surface, as it implies that fewer users are actively trading on-chain.
Traders should pay attention to a market that is more driven by speculation than by actual utility or consumer demand.
Conclusion
Bitcoin price reaches a crucial turning point with two different school of thoughts. The first tells the tale of a historic supply shortage brought on by a fundamentally optimistic scenario created by strong institutional demand.
However, the second signals caution based on on-chain data that demonstrates a noticeable decline in network growth and transaction count.
Investors are advised to keep a close eye on whether the institutional capital inflow is powerful enough to overcome the deteriorating network fundamentals, or whether this on-chain slowdown is a sign of an upcoming price correction.


