Cryptocurrency Weekly Summary
- Cryptocurrency weekly outlook highlights volatility, as early gains on softer U.S. Dollar and pro-industry news cooled amid market’s caution.
- Bitcoin slipped after hitting a fresh ATH, Ethereum stays resilient near multi-year highs, but Ripple shows mixed signals.
- Tether mining, Alaska talks, Fed rate cuts, U.S. Bitcoin Treasury, and altseason chatters dominated the news front.
- Mixed on-chain signals, Jackson Hole nerves and PMIs could offer an interesting week.
Cryptocurrency Weekly Snapshot
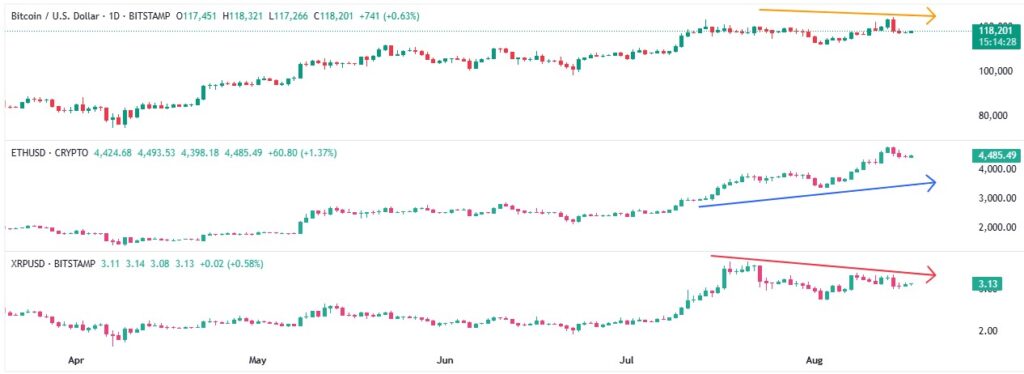
Cryptocurrency markets experienced heavy volatility last week as Bitcoin’s (BTC) record-breaking rally also fuelled altcoins amid softer U.S. Dollar and pro-industry news. The run-up, however, consolidated afterwards and pushed the BTC towards reporting the weekly loss. Still, Ethereum (ETH) ended the week on a positive note, whereas Ripple (XRP) edged lower, as traders brace for the annual global central bankers’ summit in Jackson Hole, Wyoming.
Bitcoin Hits Record High, Then Tumbles: Bitcoin (BTC) renewed its all-time high (ATH) to $124,517. However, marks the biggest daily loss since April on the same day. The following consolidation, however, failed to stop the BTC from reporting a weekly loss of around 1.0% while making rounds to $118K on Sunday.
Ethereum Heats Up: Ethereum (ETH) gained more attention as it jumped closer to its record high while reaching a four-year high, before paring some gains. The second-largest crypto, however, gained notable institutional inflows and posted over 5.0% weekly upside by snapping a three-day losing streak with $4,475 figures at the latest.
Ripple Remains Depressed: Ripple (XRP) failed to impress buyers, despite the official closure of a multi-year-long legal battle between the U.S. Securities and Exchange Commission (SEC) and Ripple Labs. That said, the altcoin drops nearly 2.0% on a week despite posting mild gains around $3.13.
The Weekly Moves
Key Macro Catalysts
Global financial markets saw a volatile week as the U.S. inflation clues and consumer data sparked speculations about the Federal Reserve’s (Fed) rate cuts ahead of the annual Jackson Hole Symposium of the global central bankers. Also important were the chatters surrounding U.S. President Donald Trump and his Russian counterpart Vladimir Putin’s meeting in Alaska.
Earlier in the week, the dicey U.S. Consumer Price Index (CPI) set the stage for the U.S. Dollar’s weakness by fueling talks of the Fed’s three rate cuts in 2025; some even argued for a 0.50% rate reduction in September.
Upbeat Producer Price Index (PPI) figures, Retail Sales, and Core Retail Sales (Retail Sales excluding Autos) poked previous dovish Fed bias and allowed the U.S. Dollar bears to take a breather.
The latest readings from the CME’s FedWatch Tool suggest a pullback in the Fed rate cut expectations for September, to 84% versus 94% on Friday and 100% earlier in the week. This also joined hawkish comments from Chicago Fed President Austan Goolsbee and the market’s consolidation before the Jackson Hole to poke the Greenback sellers.
On the geopolitical front, U.S. President Donald Trump and Russian President Vladimir Putin met in Alaska without breakthroughs or a ceasefire deal. Trump struck an optimistic tone, backing a direct peace agreement and dropping his earlier ceasefire demand, saying, “We have a very good chance of getting there.” Putin, however, stressed that “all root causes of conflict must be eliminated” and Russia’s concerns addressed. Ukrainian President Volodymyr Zelensky is expected to visit Washington soon, insisting on no deal without Ukraine’s approval. While the talks hint at a possible shift toward ending the Russia–Ukraine war, the ongoing territorial disputes keep optimists on the edge.
On a different page, the U.S. and China agreed to extend the tariff truce for another 90 days, while the Trump administration also lowered tariffs on Japan and the EU from the initial steep rates.
Crypto Market News
Apart from the broad macro catalysts, a slew of crypto news also entertained market players during the last week.
Overall, the Cryptomarket total market capitalization reached an all-time high of $4.25 trillion before retreating to $4.08 at the latest, according to data from CoinGecko.
Further, Tether’s liquidity boost via minting $1 billion in USDT also gained major attention.
Also important were headlines surrounding the U.S. Strategic Bitcoin Reserve (SBR) as Treasury Secretary Scott Bessent revealed that confiscated Bitcoin will form the SBR under President Trump’s March executive order. He clarified that the U.S. will not purchase Bitcoin directly from the market but will rely on seized assets.
Elsewhere, the U.S. Treasury and State Department offered a $6 million bounty for information on leaders of Russian crypto exchange Garantex, now rebranded as Grinex. The move exposed a $96 billion shadow economy linked to ransomware, sanctions evasion, and the ruble-backed token A7A5, with Garantex’s leaders accused of laundering over $100 million for cybercriminals.
Furthermore, a group of bankers raised concerns about the Guiding and Establishing National Innovation for U.S. Stablecoins (GENIUS) Act, which was signed by U.S. President Donald Trump. The group comprising the Bank Policy Institute (BPI), the American Bankers Association, the Consumer Bankers Association, and others urged Congress in a letter to alter the GENIUS Act. The letter cited fears of a $6.6 trillion drain from the U.S. banks due to a loophole in the GENIUS Act.
Read Details: U.S. Bankers Warn GENIUS Act Loophole Could Drain $6.6 Trillion From Banks
Meanwhile, the U.S. Securities and Exchange Commission (SEC) formally announced the closure of its long-standing legal battle with Ripple Labs. Also positive were comments from SEC Chairman Paul Atkins, who said that the “Project Crypto” will primarily focus on providing “clarity and certainty” to industry players.
Additionally, El Salvador’s approval of the world’s first Bitcoin investment banks again marked the nation as the global leader in the crypto universe.
Also read: El Salvador Doubles Down: World’s First Bitcoin Investment Banks Approved
Having discussed the overall market performance and major crypto drivers, let’s focus on the individual cryptocurrencies.
Bitcoin, Gold slip, but Equities Edge Higher
Bitcoin (BTC) price dropped for three of the last seven days, despite refreshing its record high, as market sentiment dwindled amid concerns about the U.S. Federal Reserve (Fed) and the trade/political pressure. Apart from the stellar fall on the same day of its ATH, a slew of on-chain signals and growing investor shift towards Ethereum also challenge Bitcoin bulls. Let’s start discussing the key BTC moves and data to understand the crypto major’s action.
To begin with, the correlation chart from TradingView, Bitcoin (BTC) and the spot Gold (XAU) both reported the weekly loss, trading in tandem, but the U.S. equity benchmark S&P 500 reported the week-on-week (WoW) gains, portraying a divergence in the investment pattern. This suggests the need for caution among the BTC traders as the Jackson Hole updates and the Purchasing Managers Index (PMI) for August loom.
The S&P 500 refreshed its ATH during the week, dropped two days out of five, before reporting 1.0% weekly gains to 6,450 at the latest.
Gold (XAU/USD) appeared somewhat dicey and ended the week on a negative note. That said, the bullion posted the first weekly loss in three, finishing around $3,335, thanks largely to its fall on Monday and Thursday—fueled by the market’s indecision and the U.S. Dollar’s corrective moves.
BTC, S&P 500, and Gold

ETF Signals, On-Chain Developments Test BTC Bulls
Starting with the latest U.S. spot Exchange Traded Fund (ETF) data from the SoSoValue, the Bitcoin (BTC) spot ETFs recorded a six-day inflow pattern before stalling the move with Sunday’s mild losses.
That said, the weekly total net inflow was $547.85 million, the highest in four weeks, versus last week’s $246.75 million.
Still, the monthly BTC ETF figures for August snap the four-month uptrend with an outflow of $17.67 million, versus July’s $6.02 billion in inflows.

With this magnitude of surprise from the ETF flows on a monthly basis, a pullback in the BTC prices was justifiable. However, this doesn’t signal the start of a bearish Bitcoin trend unless the outflows continue in the coming sessions.
Bitcoin Whales, Transaction Volume, and MVRV Ratio Eyed
Apart from the U.S. spot BTC ETF data, performance of the key wallets, a bearish divergence per the transaction volume, and the Market Value to Realized Value (MVRV) metric also challenge the Bitcoin buyers.
Bitcoin Supply Distribution for August 11-17
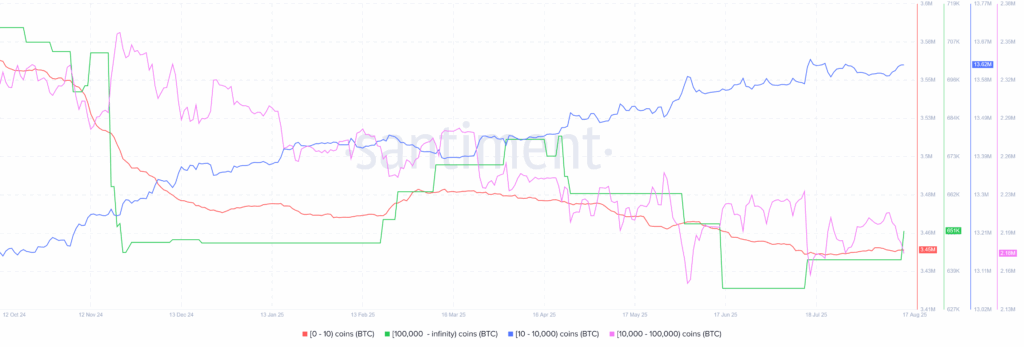
As per the Santiment data for August 11-17, the wallets (addresses) holding 10–10,000 BTC, known as sharks, increased their holdings by 27,060 BTC, marking a 0.2% accumulation.
On the other hand, the retail wallets (holding 0–10 BTC) reduced 143.27 BTC (or +0.001% cut), while the whales (wallets with 10,000–100,000 BTC) cut their holdings by 33,036.85 BTC, or -1.49%.
Meanwhile, the mega-wallets, wallets with over 100,000 BTC holdings, showed an increase of 8620.12 BTC in their holdings, up 1.34% during the stated period.
Hence, the sharks and mega wallets are increasing their positions, but the whales cut their holding, with the retail investors being indecisive. This, in turn, suggests a possible sign of long-term confidence despite the short-term uncertainty.
Transaction Volume, MVRV Data Flashes Warnings
Elsewhere, Bitcoin’s jump to a record top and the following retreat came with a clear warning that the market was overheating, at least per the Santiment data. It’s worth noting that the Transaction Volume (in U.S. dollars) edged lower despite BTC’s record-breaking rise, and the MVRV (Market Value to Realized Value) ratio, which compares the current price to the average cost basis of holders, remains near risky levels. Both these catalysts signal a weak foundation for the rally and flag risks of profit-booking.
Bitcoin (BTC) Transaction Volume, MVRV Data
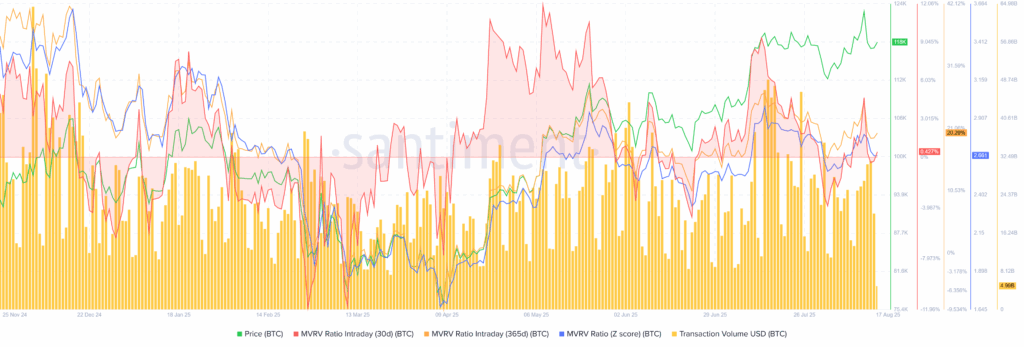
The BTC’s Transaction Volume in USD fails to accompany the price strength and raise pullback fears. That said, the Transaction Volume rose to a three week high when Bitcoin refreshed its ATH, before falling for the last two consecutive days to $4.99 billion at the latest.
Elsewhere, the BTC’s 365-day MVRV stays firmer past 20%, showing long-term holders are deep in profit. Such elevated MVRV levels often signal that many investors may start taking profits, increasing the risk of a pullback in prices.
It should be noted that the 30-day MVRV prints mild gains of around 0.43%, and suggests a potential BTC strength for the short-term.
That said, the recent divergence between Bitcoin’s price, transaction volume, and the 365-day MVRV ratio warrants buyers to remain cautious, especially if fundamentals turn less favorable.
Technical Analysis Favors BTC Bulls
A five-month-old “Rising Wedge” bearish pattern and the BTC’s pullback from the upper Bollinger Band (BB) test the bulls. However, Bitcoin stays above the key Simple Moving Averages (SMA), and the Directional Movement Index (DMI) remains bullish, hinting at more upside, even as the Moving Average Convergence Divergence (MACD) shows mixed signals, keeping traders cautious.
Bitcoin Price: Daily Chart Suggests Further Upside
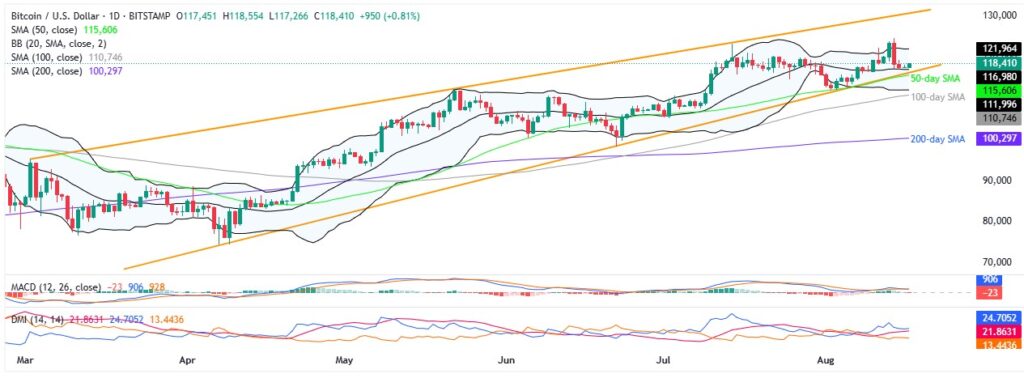
Last week’s BTC pullback could be linked to its failure to stay beyond the Bollinger Band’s (BB) upper boundary.
Still, the Directional Movement Index (DMI) defends the bullish bias with the Upmove line (Blue) staying near the 25.0 trend-positive limit, and the Average Directional Index (ADX) line (the red one) is near 21.00, offering additional information on the bullish momentum.
Meanwhile, the MACD signals remain dicey of late, requiring traders to remain cautious.
That said, the quote’s latest rebound from the middle BB hints at another attempt to confront the upper band of the Bollinger, close to $122K.
However, Bitcoin’s upside past $122K will highlight the latest ATH near $124,500, quickly followed by the $125K round figure. Following that, a 6.5-month-old rising trend line highlights the $130K as the key upside hurdle for the BTC bulls to watch.
Ethereum Pullback Appears Overdue
Ethereum rocked the boat with its 5% weekly gains, surpassing Bitcoin (BTC) and Ripple (XRP), as traders cheered institutional demand. However, on-chain signals about the second-largest cryptocurrency flash warning signs.
ETH ETFs Need Consolidation
The U.S. Ethereum (ETH) spot ETFs rose for eight consecutive days before posting an outflow on Friday, as per SoSoValue. Even so, the weekly ETH ETF inflows are staggering to raise eyebrows.

On August 15, the U.S. Spot ETH ETFs reported it’s first daily outflow in nine, with a meagre $59.34 million figures.
Still, the weekly ETH ETF flows remained positive for the 14th consecutive week, totalling $2.85 billion, to print the record inflows and raise fears of the market’s consolidation if fundamentals shift. Meanwhile, July saw a record-breaking $5.43 billion in the U.S. spot ETH ETF inflows, extending its four-month uptrend, whereas August saw $3.03 billion of total inflows so far.
Ethereum’s MVRV Ratio Flashes Warning Signs
Ethereum’s jump to a multi-year high and weekly gain, despite a retreat, came with a clear warning that the market was overheating, at least per the Santiment data. The MVRV (Market Value to Realized Value) ratio, which shows the traders’ profitability, remains near the risky levels, pointing to a weak foundation for the rally and flags risks of profit-booking in the ETH prices.
Ethereum (ETH) MVRV Data

ETH’s 365-day MVRV portrays a stellar 53% gain, showing long-term holders are deep in profit. Such elevated MVRV levels often signal that many investors may book profits, increasing the risk of a pullback in prices. It should be noted that the 30-day MVRV is also over 11% up, and suggests a potential ETH retreat for the short-term.
MDIA, Transaction Volume Also Pokes ETH Bulls
Not only the MVRV, but the Mean Dollar Invested Age (MDIA) metric, which tracks the average age of invested capital, and a pullback in the transaction volume also challenge further bullish bias surrounding the ETH.
Ethereum (ETH) MDIA, Transaction Volume
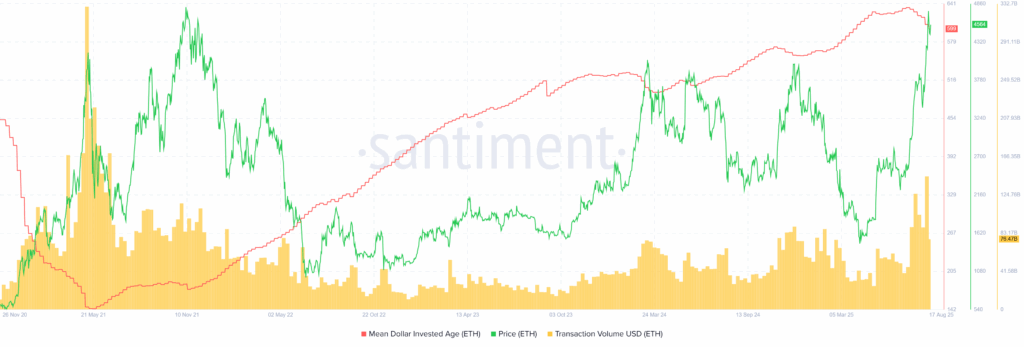
ETH’s MDIA has been in a pullback mode since mid-July, indicating that older, dormant Ethereum coins are finally being transacted. This fresh movement of old coins often coincides with Ethereum’s price rallying over 80% since July 01 to push long-term holders toward profit-booking and fuel the market volatility.
Meanwhile, the ETH’s Transaction Volume in USD fails to accompany the price strength and raises pullback fears. That said, the Transaction Volume rose to a four-year high when Ethereum jumped to the highest level since 2021. However, the following pullback in Transaction Volume was steeper than the price pullback and hence suggests a tepid momentum to back the bulls. That said, the ETH’s latest transaction volume retreats to $76.47 billion at the latest.
ETH/BTC Chart Favors Ethereum Bulls
While the on-chain signals are mixed and the ETF inflows raise worries, the ETH/BTC ratio suggests a steady strength of Ethereum (ETH) compared to Bitcoin (BTC). The ratio’s latest U-turn from the 50% Fibonacci retracement of May 2024 to April 2025 downturn, as well as the successful trading above the 200-day SMA and previous key resistances, now supports, keeping ETH buyers hopeful.
ETH/BTC: Daily Chart
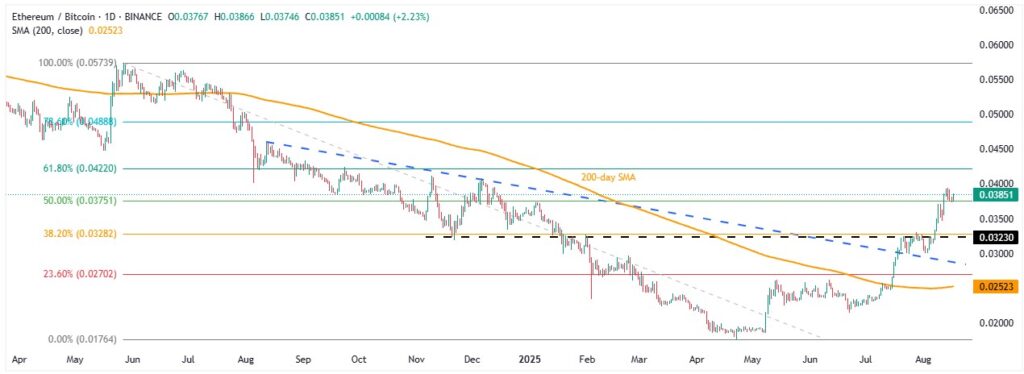
ETH/BTC ratio bounces off the 50% Fibonacci Retracement of its May 2024 to April 2025 downturn, close to 0.03751, and keeps the aforementioned resistance breakouts to suggest the ETH/BTC pair’s further advances.
This highlights the 61.8% Fibonacci ratio of 0.04220 for buyers before the mid-August 2024 peak surrounding $0.4590.
Meanwhile, the ETH/BTC ratio’s pullback needs a sustained downside break of the 50% Fibonacci retracement level, close to 0.03751, to recall sellers. Even so, the previous resistance lines from November and August 2024, respectively, near 0.03250 and 0.02900, could test the bears before giving them control.
Overall, the ETH/BTC ratio points to a stronger Ethereum price compared to Bitcoin in the short-term, as well as in the long-term.
Ethereum Technical Analysis Signals Gradual Upside
Ethereum’s technical analysis suggests a trend-widening formation and continuation of two-month upside. However, the stochastic indicator could join the “rising mehapgone” pattern to offer intermediate pullbacks in the ETH prices.
Ethereum Price: Daily Chart Signals Short-term Recovery

Ethereum’s latest rebound from the 10-day SMA gains little support from the overbought stochastic, above the 80.00 threshold, suggesting increased odds of witnessing a consolidation in the prices.
This highlights last week’s multi-month high of near $4,790 as the immediate key resistance before the stated megaphone’s upper boundary surrounding $4,930.
Also acting as an important resistance is the altcoin’s all-time high (ATH) marked in November 2021, around $4,867, quickly followed by the widely-discussed bullish target for the ETH, namely the $5,000 mark.
Alternatively, a daily closing beneath the 10-day SMA support of $4,405 could quickly drag the ETH price to the tops marked since March 2024 and a descending trend line from November 2021, respectively near $4,090 and $3,925.
Below that, the trend-widening chart pattern’s lower boundary near $3,830 will be the last defense of the Ethereum buyers.
Overall, Ethereum’s pullback appears overdue, but the broad bullish trend is likely to prevail.
Ripple Remains Unimpressive
Ripple (XRP) dropped nearly 2.0% last week and fell short of tracing the up-moves in Bitcoin and Ethereum. In doing so, the altcoin failed to cheer the official closure of the Ripple Lab’s multi-year court battle with the U.S. Securities and Exchange Commission (SEC).
The XRP’s latest pullback could be linked to a likely profit-booking by the long-term buyers, as per the MVRV (Market Value to Realized Value) ratio. However, the whale buying has been increasing of late and suggests a likely recovery in the prices.
Ripple’s MVRV and Whale Buying Flash Mixed Signals
Despite the latest pullback, the XRP’s 50% price rally in 2025 bolstered the traders’ profitability and might have allowed them to cash out, which in turn backs the quote’s latest softness in prices. Even so, the whale activity keeps being a strong supporter of the Ripple buyers.
The MVRV (Market Value to Realized Value) ratio from Santiment, which compares the current price to the average cost basis of holders, spiked to risky levels when the XRP/USD pair hit a record high, resulting in the following pullback.
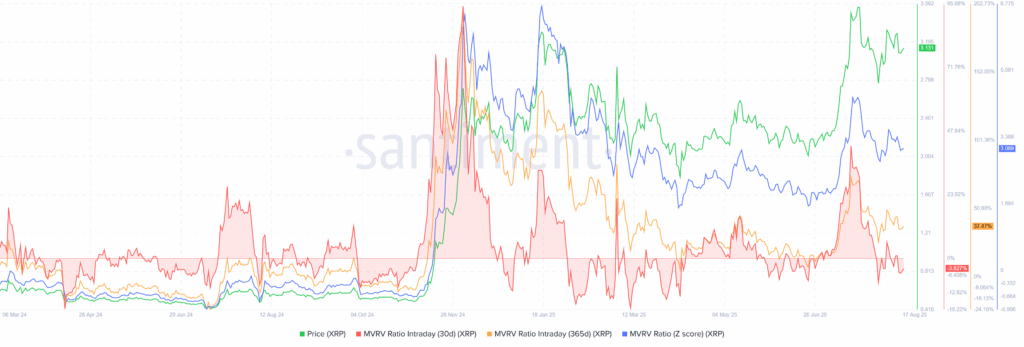
At its top, the XRP’s 365-day MVRV surged above +70%, close to 37% at the latest, showing most holders were deep in profits despite the latest retreat. Such elevated MVRV levels often signal that many investors may start taking profits, increasing the risk of a pullback in prices, which ultimately could be witnessed in Ripple’s performance after it hit the all-time high (ATH). In short, the rally pushed XRP into overvalued territory, and then the consolidation happened. It should be noted that the 30-day MVRV turned negative and suggests a potential pullback for the short-term.
Elsewhere, wallets holding 1 million or more XRP, known as whales, hit a record high of 2,747 earlier in July but retreated to 2,671 by the end of August 16, with these wallets collectively holding roughly $47.47 billion in XRP, down from $47.59 billion marked on July 01. With this, Ripple buyers show confidence and suggest further upside in prices, even as the number of wallets is declining.
XRP 1M+ Coin Balance By Number & Total Balance Held
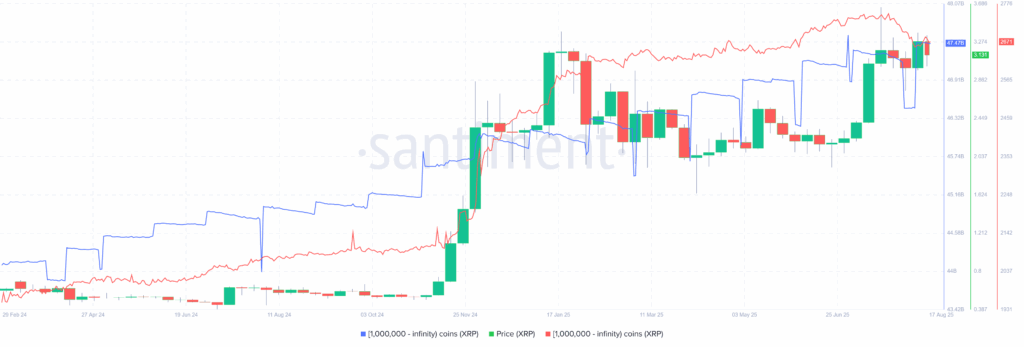
To sum up, the recent consolidation in the MVRV ratio and the XRP whale wallets suggest a potential rebound in the prices, unless the fundamentals are negative. Even so, the long-term upside bias needs a correction amid overheated profitability.
XRP Technical Analysis Favors Gradual Upside
From a technical standpoint, XRP stays between a seven-month-old broad horizontal resistance zone, surrounding $3.33-$3.36, and an eight-week support line, close to $3.06. The consolidation bias also takes clues from the bearish MACD signals and steady RSI line.
XRP/USD: Daily Chart Signals Slow Rise

With the quote’s latest rebound from the short-term key support, backed by slightly positive RSI, buyers are likely approaching the multi-month resistance area near $3.33-$3.36.
Beyond that, the XRP’s all-time high (ATH) of around $3.66 will be the key resistance to watch for buyers before they aim for the $4.00 threshold.
Alternatively, a downside break of $3.06 support won’t recall the XRP bears as the 50-day Exponential Moving Average (EMA) will put a short-term floor under the prices near $2.94.
In a case where the XRP offers a daily closing beneath the $2.94 EMA support, a five-month horizontal area near $2.65, the 200-day EMA support of $2.44, and an ascending trend line from late November, close to $2.19 at the latest, will be the last defense of buyers.
Conclusion
Last week showed why price alone doesn’t tell the full story.
Bitcoin made headlines with a new all-time high (ATH), but on-chain metrics painted a more cautious picture, revealing hidden risks beneath the surface.
Further, signs of extreme profitability point to consolidation in the Ethereum prices, while Ripple’s (XRP) weak on-chain performance explains its muted price reaction.
Moving on, the August 21-23 gathering of top global central bankers, including Fed Chair Powell, at Jackson Hole will be the key event of this week. Also in the spotlight will be the first readings of August PMI (Purchasing Managers Index) data releases from major economies.
If the PMIs remain in the expansion territory, above 50.00, and the major central bankers defend their data-driven policy stance, the U.S. Dollar (USD) could recover. This might weigh on the cryptocurrencies, particularly if Powell strikes a hawkish tone in his remarks.
Apart from that, developments around the Ukraine-Russia peace deal and the U.S. tariff updates could also allow the U.S. Dollar to rebound in case of risk-aversion, exerting downside pressure on the cryptocurrencies in that case.
Overall, while crypto assets are slowly gaining the “digital gold” status, rising market anxiety could only translate into meaningful corrections if backed by a stronger U.S. Dollar. If fundamentals align, overheated on-chain indicators for Bitcoin and Ethereum could trigger a notable pullback. Ripple (XRP), however, may remain uncertain in the near term.


