- The crypto market started the fresh trading week on a negative note.
- Gold’s record high, cautious sentiment, technical breakdowns, and long liquidations spark the latest crypto sell-off.
- Crypto market cap falls over 3%, with Ethena catching the bear’s eye after a 20% drop.
- Traders watch for risk catalysts to guide market direction, hoping for a corrective bounce.
Cryptocurrency markets witnessed a grim Monday as top-tier coins posted losses ranging from 2.0% to 20% due to wide-ranging catalysts from risk-aversion to long liquidations and technical breakdown.
Among the major losers, Ethena (ENA) gained attention with its 20% slump, while Dogecoin (DOGE), Uniswap (UNI), Pepe (PEPE), Toncoin (TON), and Aave (AAVE) each lost more than 10%.
That said, Bitcoin (BTC) dropped nearly 3.0% and Ethereum (ETH) marked a 7.0% fall, whereas Ripple (XRP) dropped 6.0% on a day by press time.
Also read: Ethereum Price Today: ETH Slumps 6.0% amid this Bearish Formation; Is $4,000 Next?
The total crypto market capitalization (market cap) dropped 3.80% to $3.88 trillion, per CoinMarketCap. The famous crypto portal’s CMC20 crypto index also posts a 3.87% intraday loss to $246.42 by press time.
Among the key catalysts, the heavy long position liquidation gained major accolades from the media. Position liquidation is the forced closing of a trader’s positions by a broker due to insufficient margin. This data reveals whether long (buy) or short (sell) positions were closed, helping explain recent price movements. Typically, heavy long liquidations happen during a downtrend and suggest short-term bearish sentiment, just like we see today.
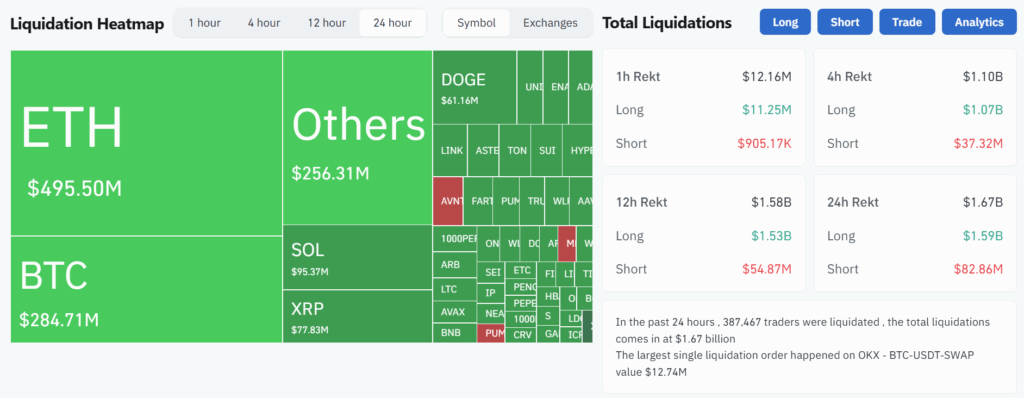
As per the CoinGlass’ Liquidation HeatMap, out of the total $1.67 billion total liquidation in the last 24 hours, $1.59 billion were long positions, citing the reason for the market’s latest fall.
Liquidation HeatMap Signals Crypto Falling

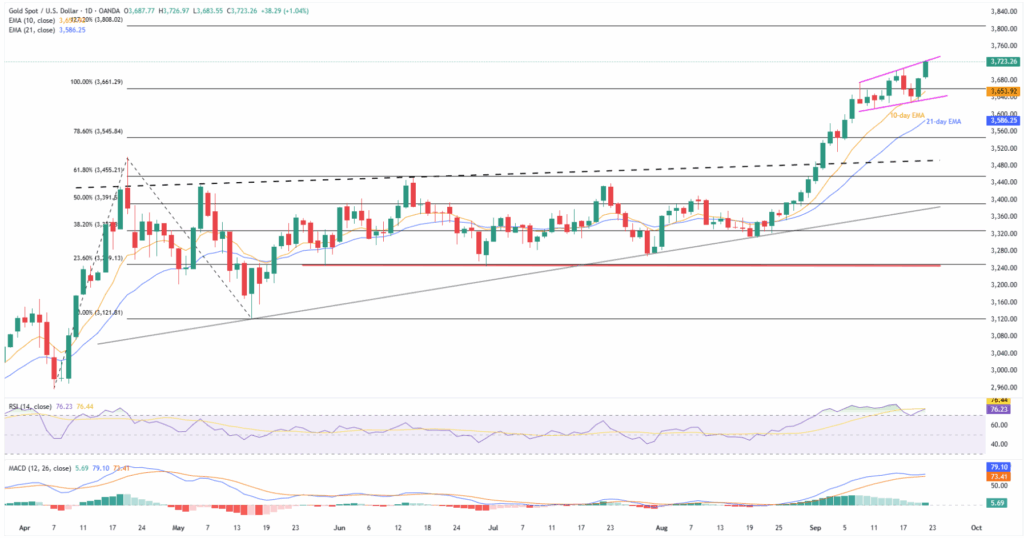
The record high in gold prices has also played a role in the latest cryptocurrency market movements. As investors look to capitalize on gold’s strong performance, funds do shift from crypto towards lucrative assets, especially following last week’s mixed crypto market results. This shift, coupled with a cautious market sentiment, is contributing to the ongoing sell-off in digital assets.
Gold Price Hits Fresh ATH

Elsewhere, market sentiment is challenged by fresh doubts about the Federal Reserve’s (Fed) future rate cuts, especially after last week’s mixed data and hawkish statement from Fed Chairman Jerome Powell.
On the same line, mixed clues from trade discussions between U.S. President Donald Trump and Chinese President Xi Jinping, and looming geopolitical fears, also weigh on the market’s risk appetite and contribute to the cryptocurrency fall.
Additionally, traders are also cautious ahead of this week’s key data and events, which in turn adds to the market’s shift from crypto currencies toward Gold. Among this week’s top-tier catalysts, the preliminary readings of September Purchasing Managers’ Indices (PMIs) for major economies, a speech by Federal Open Market Committee (FOMC) Chairman Jerome Powell, and the release of the U.S. Core Personal Consumption Expenditures (PCE) Price Index, the Fed’s preferred inflation gauge, gain major attention.
Bitcoin Technical Analysis
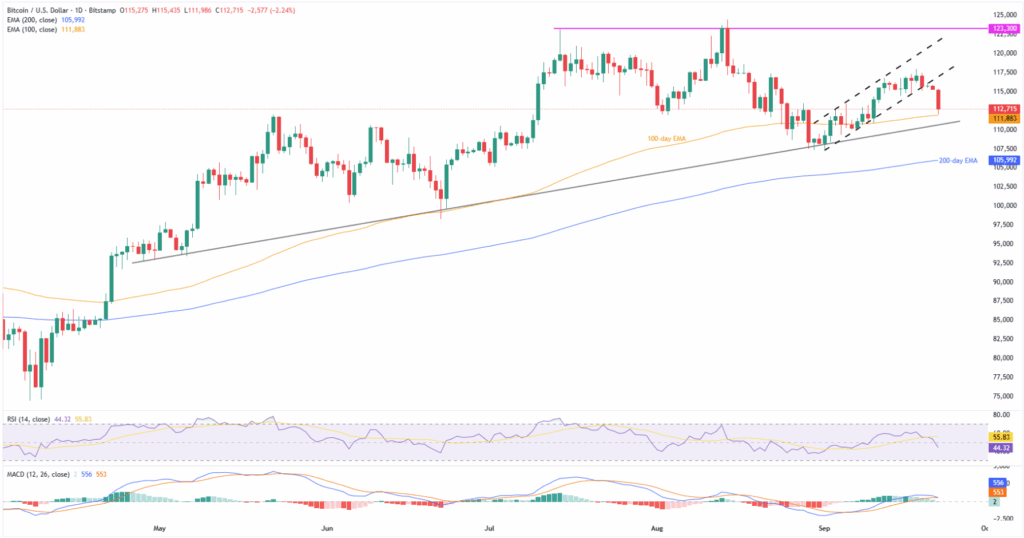
Bitcoin (BTC) drops over 2.0% while justifying last week’s rejection of a three-week bullish channel. Adding strength to the downside bias is the impending bearish crossover on the Moving Average Convergence and Divergence (MACD) momentum indicator. On the same line, the 14-day Relative Strength Index (RSI) is also below the 50.0 neutral limit and lures the BTC sellers.
Bitcoin Price: Daily Chart Suggests Limited Downside Room

Still, the 100-day Exponential Moving Average (EMA), currently around $111,800, could stop the short-term BTC sellers. If not, then a five-month ascending trend line support of $110,600 and the 200-day EMA support of $105,990 will be tough nuts to crack for bears.
Notably, Bitcoin’s slump beneath $105,990 could make it vulnerable to break the $100K psychological magnet while targeting June’s low of $98,240.
Alternatively, BTC rebound remains elusive beneath the stated channel’s bottom surrounding $117K.
Following that, a two-month-old horizontal resistance line, near $123,300, and the all-time high (ATH) around $124,500 could challenge the BTC’s bulls before directing them toward the $130K psychological magnet.
Overall, the BTC sellers are likely to keep the reins for the short-term, but the broader bullish trend holds.
Conclusion
On Monday, the crypto bears cheered cautious sentiment, long liquidations, and technical breakdowns, along with the impact of gold’s record high. However, the major coins haven’t yet broken the key technical supports, and this week’s top-tier data/events are still eyed. This could allow crypto traders to look for a corrective bounce as they monitor key risk catalysts.
Also read: Cryptocurrency Weekly Price Prediction: BTC Holds, But ETH & XRP Dip as Dollar Edges Upc


