- Aave price rises for the third consecutive day, poking 10-day SMA with eyes on weekly top.
- Neutral Stochastic suggests a slow continuation of recovery from 100-day SMA.
- 10-week-old rising wedge can put a broad bullish bias at risk if AAVE breaks $265.00 on daily closing basis.
- Aave’s gradual rise looks likely, but upside may be capped below $345.00.
Aave (AAVE) price prints a three-day winning streak around $302.00 during Friday’s European session.
In doing so, the altcoin buyers jostles with the 10-day Simple Moving Average (SMA) hurdle while cheering news about Aave’s integration of Chainlink’s Price Feeds on Aptos, opening doors for Decentralized Financing (DeFi) opportunities outside the current Ethereum based chains.
Also read: Coin Bytes
However, the market’s cautious mood ahead of the Federal Reserve (Fed) Chairman Jerome Powell’s speech at Jackson Hole and the neutral Stochastic indicator challenge the AAVE bulls aiming for Sunday’s weekly top.
Notably, the AAVE daily trading volume also remains within a weekly range, currently around $492.92 million per Santiment, even as the market cap rises to the highest level since August 15 with $4.61 billion latest figure.
Aave Price: Daily Chart Suggests Gradual Run-Up

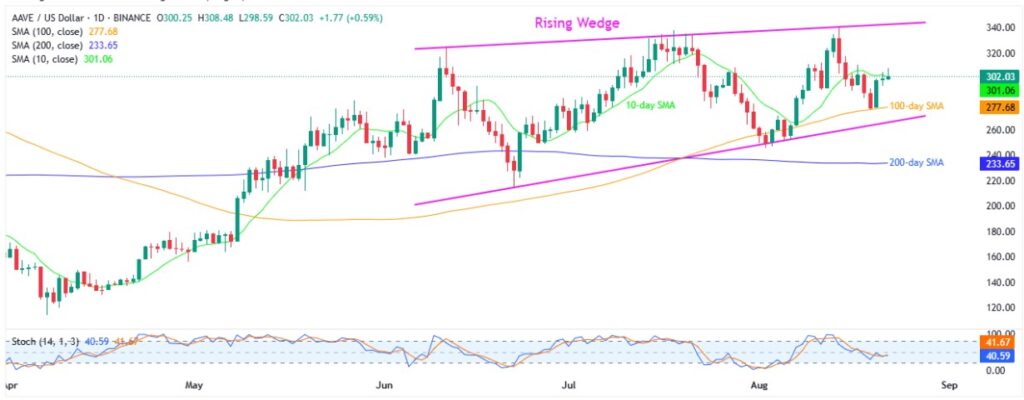
Aave’s successful recovery from the 100-day SMA and a steady Stochastic indicator near the neutral 50.00 threshold suggest the altcoin has the potential to break above the immediate 10-day SMA resistance level of $301.00 on a daily closing basis.
This opens the door for the AAVE’s run-up toward June’s high, surrounding $325.50.
However, multiple upside hurdle from July, including the upper boundary of a 10-week-old “Rising Wedge” bearish chart pattern, highlights the $338.00-$345.00 region as the key challenge for Aave bulls.
Should the quote manage to cross the $345.00 mark, it becomes capable of targeting the 2024 peak surrounding the $400.00 psychological magnet.
On the flip side, Aave’s failure to provide a daily closing beyond the 10-day SMA hurdle of $301.00 might drag it back to the early-July swing high surrounding $285.00.
Still, the 100-day SMA level of $277.00 and the stated wedge’s bottom line, close to $265.00, will be the final line of defense for the buyers, a break of which could challenge the broad bullish trend.
It should be noted that the 200-day SMA support of $233.00 might act as an additional downside filter during the quote’s rush towards the rising wedge’s theoretical target of $138.00.
Aave Price: Four-Hour Chart Allows Bulls To Take A Breather

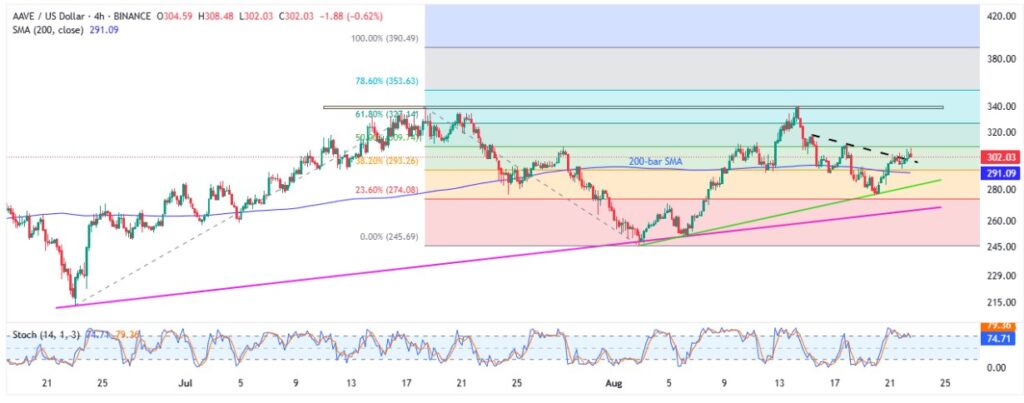
Even if the Stochastic indicator flashes overbought signs on the four-hour chart, the AAVE’s sustained trading beyond the 200-bar SMA and a defense of the one-week-old resistance breakout, now immediate support near $300.00, keeps the buyers hopeful.
If Aave breaks below the immediate support at $300.00 and the 200-bar SMA of $291.00, a three-week-old ascending trend line near $281.00 will act as the next key support, followed by the bottom line of the previously mentioned rising wedge around $265.00, both of which could challenge the bears before they gain full control.
Meanwhile, a five-week-old horizontal resistance area surrounding $338.00-$341.00 can lure the AAVE bulls during the potential slow rise, in addition to the higher levels mentioned on the daily chart.
Conclusion
The 10-day SMA and an overbought Stochastic indicator on the four-hour chart limit AAVE’s immediate upside. Still, it’s sustained trading above key support levels, a neutral momentum indicator on the daily chart, and supportive fundamentals suggest a gradual upward move in prices.


