- Aave dribbles at one-week low, testing three-month bullish trend while stabilizing below 200-bar SMA for the first time in two months.
- Break below key SMA weighs on AAVE/USD, but $243.00 confluence support limits downside.
- RSI, MACD support gradual downside bias, yet the overall bullish trend stay resilient.
Aave (AAVE/USD) trades around $260 after dropping to a one-week low, with a slight recovery during Thursday’s European session. This marks the pair’s first sustained move below the 200-bar Simple Moving Average (SMA) on the four-hour chart since April, raising doubts about the strength of its three-month bullish trend.
Bearish momentum is supported by negative signals from the Moving Average Convergence Divergence (MACD) indicator and the 14-day Relative Strength Index (RSI), both showing weakening strength.
However, several key support levels are still intact, creating strong barriers for sellers and delaying a clear market shift—for now.
AAVE/USD: Four-Hour Chart Teases Bears

Source: Tradingview
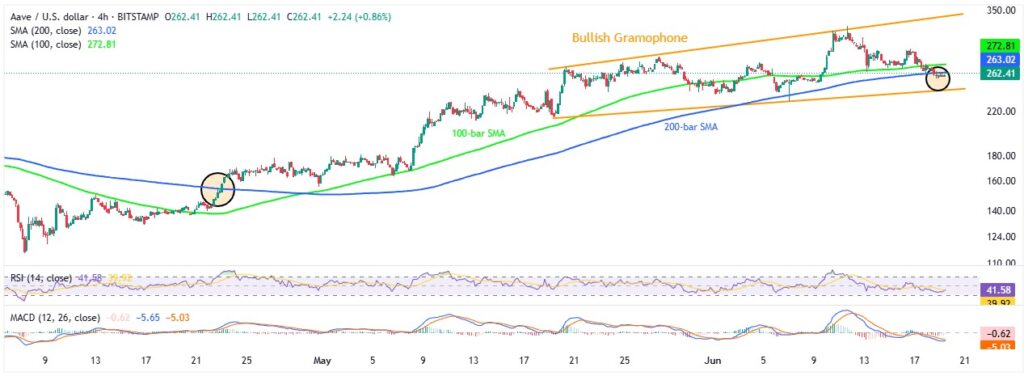
Aave (AAVE/USD) slips below the 200-bar SMA again after last week’s false breakdown—this time stabilizing below it. The weakness matches bearish signals from the MACD and a falling 14-day RSI, now near 41.00 and approaching oversold levels.
A month-old “Bullish Gramophone” (broadening wedge) pattern could limit losses near $243.00, a key support zone. With RSI nearing oversold, this level might slow the downtrend.
However, a clear break below $243.00 could threaten the three-month uptrend, opening the door to deeper losses toward $210.00, $200.00, and possibly the early-May high near $181.00.
For a rebound, Aave must reclaim the 200-bar and 100-bar SMAs at $263.00 and $272.00. Still, bulls will face tough resistance at the $300.00 psychological level and near $340.00—the top of the broadening wedge.
AAVE/USD: Daily-Hour Chart Teases Bears

Source: Tradingview
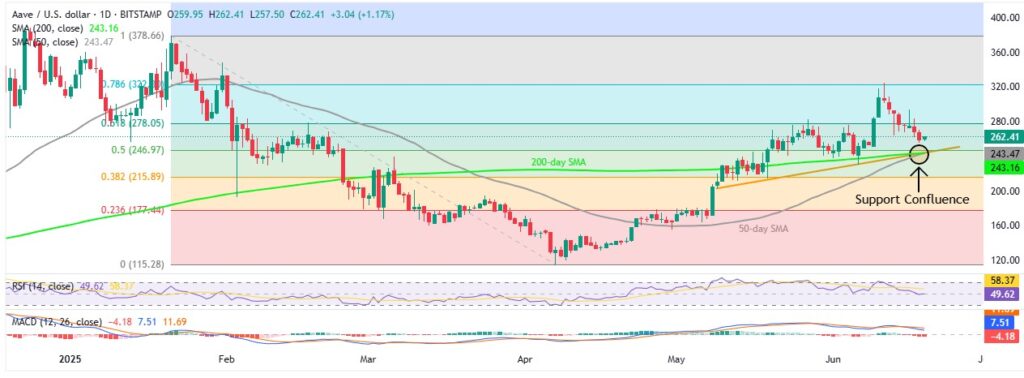
Aave (AAVE/USD) holds just below the 200-bar SMA on the four-hour chart, but the daily chart suggests a smoother slide toward key support at $244.00–$243.00.
This support zone is reinforced by the 50-day and 200-day SMAs, plus a rising trendline from early May.
On the daily chart, the RSI shows stronger momentum than the four-hour chart, but the MACD signals deeper bearish pressure—posing a challenge for bulls.
A daily close below $243.00 could trigger a sharper drop, targeting the 38.2% and 23.6% Fibonacci Retracement levels of the January–April rally, at around $215.00 and $177.00.
Upside attempts face resistance at the 61.8% Fibonacci level (the “Golden Ratio”) near $278.00. A strong break above this could fuel a rally toward the monthly high at $325.00 and, if momentum continues, the yearly high at $378.40.
Overall, AAVE/USD faces short-term downside risks, but its broader bullish trend remains largely intact—for now.


