- Aave price gains over 1.0% intraday, up for the second straight day after hitting a seven-week low.
- AAVE rebounds as the 200-day EMA and May’s trendline converge, with Stochastic turning up from oversold levels
- The confluence of the 50-day EMA and support-turned-resistance from April holds the key to welcoming Aave bulls.
- A daily close below $267.00 may deepen AAVE’s yearly loss, but holding above defends buyers’ hopes for a reversal.
Aave (AAVE) is showing signs of strength, hitting an intraday high near $280.00 with a 1.50% gain early Wednesday in New York.
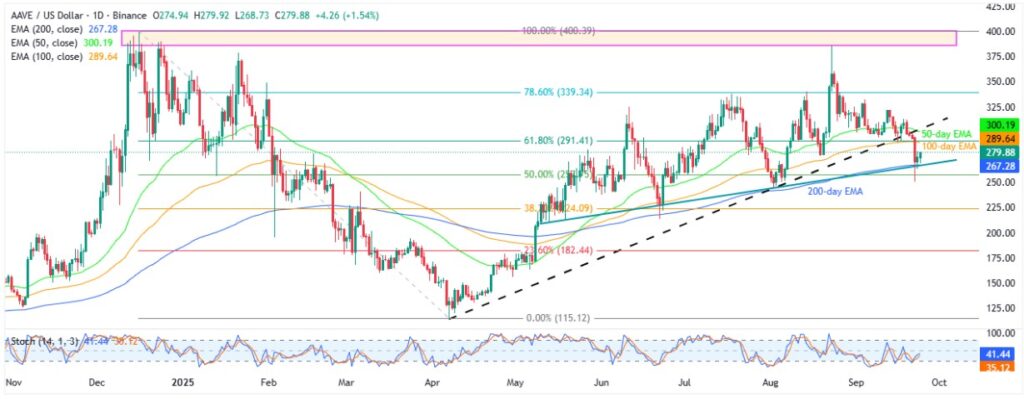
This marks the second consecutive day of positive momentum for the altcoin, following its rebound from the convergence of the 200-day Exponential Moving Average (EMA) and an ascending trend line from May.
Also read: South Korea’s Bithumb Partners With World Liberty Financial, Global DeFi Growth in Focus
Besides solid technical support near $267.00, discussed above, AAVE’s recovery is reinforced by the Stochastic momentum indicator bouncing up from the oversold zone below 20, strengthening the case for a continued rebound.
Furthermore, an improvement in the trading volume and market capitalization (market cap) also backs AAVE’s latest rebound, suggesting further upside. According to Santiment, Aave’s daily trading volume rises to $514.25 million, while the market cap extends the early-week recovery from a seven-week low to $4.25 billion.
However, the earlier breakdown of the multi-month support trendline, now acting as resistance, along with the 50-day EMA, keeps buyers cautious below the $300.00 level.
Aave Price: Daily Chart Suggests Gradual Run-Up

Aave’s successful U-turn from a convergence of the 200-day EMA and ascending trend line from May, close to $267.00, gains additional strength from the Stochastic as it bounces off the oversold territory.
This suggests the altcoin’s further rise toward the 100-day EMA and 61.8% Fibonacci retracement of its December-April fall, close to $290.00.
However, the 50-day EMA and previous support line from April converge near the $300.00 threshold to offer a tough nut to crack for the AAVE bulls.
Should the quote manage to stay firmer past $300.00, it becomes capable of renewing the monthly high, which in turn shifts the market’s attention to the 78.6% Fibonacci ratio near $340.00.
Above all, an area comprising the yearly peak and late 2024 tops, around $386.00-$400.00, acts as the final defense of the AAVE bears, a break of which will allow prices to aim for the late 2021 high near $483.00 and ultimately the all-time high of $707.67.
On the flip side, a daily close below the $267.00 support zone could open the door for further downside, with the 50% and 38.2% Fibonacci retracement levels near $257.00 and $224.00 acting as key supports for AAVE bears to watch.
Beneath that, the $200.00 threshold and the yearly low of $114.00 could attract selling pressure.
Aave Price: Four-Hour Chart Portrays Bullish Formation

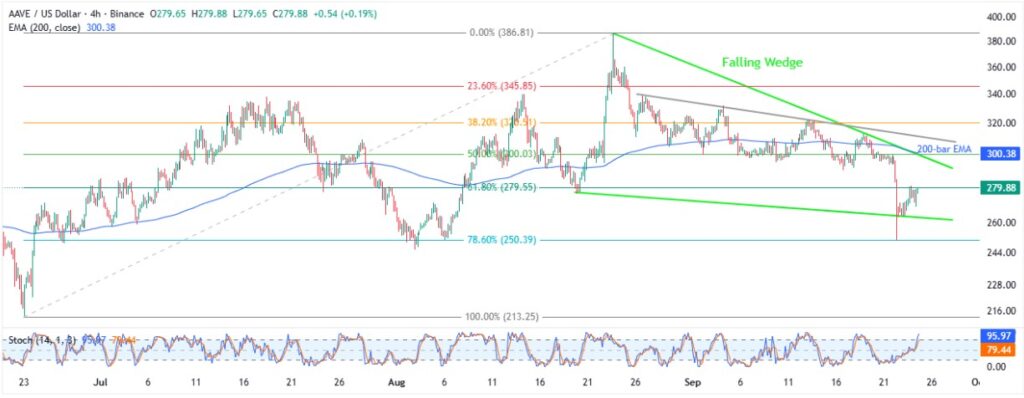
Aave’s four-hour chart portrays a five-week-old “Falling Wedge” bullish chart formation, currently between $262.00 and $301.00. Adding strength to the upside filter is the 200-bar EMA.
Notably, the Stochastic approaches the overbought territory and hence suggests a slow grind towards the north.
That said, AAVE’s upside break of $301.00 highlights the theoretical target of $420.00. However, a month-old falling resistance line near $311.00 and the yearly high near $386.00 can act as intermediate halts during the potential rise. Beyond that, the daily chart’s resistance levels will be in the spotlight.
On the contrary, a downside break of $263.00 will defy the bullish chart formation, shifting the market’s attention to the 78.6% Fibonacci ratio of $250.00.
Below that, June’s low of $213.00 and deeper levels discussed on the daily chart will be in the spotlight.
Conclusion
Aave (AAVE) price signals short-term strength, backed by firmer momentum and solid technical indicators. Adding to the upside bias is a bullish chart pattern on the four-hour formation. However, a decisive break above the $300.00 resistance level is crucial for the AAVE bulls to regain control, especially after the early September setback. Hence, buyers look poised to take charge, but reversing the yearly loss will require a much stronger push.
Also Read: Cryptocurrency Weekly Price Prediction: BTC Holds, But ETH & XRP Dip as Dollar Edges Up


