- Aave price faces first weekly gain in three after crossing two-week resistance.
- AAVE bulls face short-term EMA pressure, but trendline breakout, strength above long-term EMAs, and upbeat momentum indicators support upside potential.
- Sellers need a break below $263 to regain control, while bulls face strong resistance with multiple hurdles near $400.
- AAVE is set to reverse yearly losses, but further upside will depend on a strong bullish catalyst.
Aave (AAVE) price gains almost 2.0% intraday to around $306.00 early Thursday morning in New York, facing the first weekly gain in three after crossing a two-week resistance the previous day.
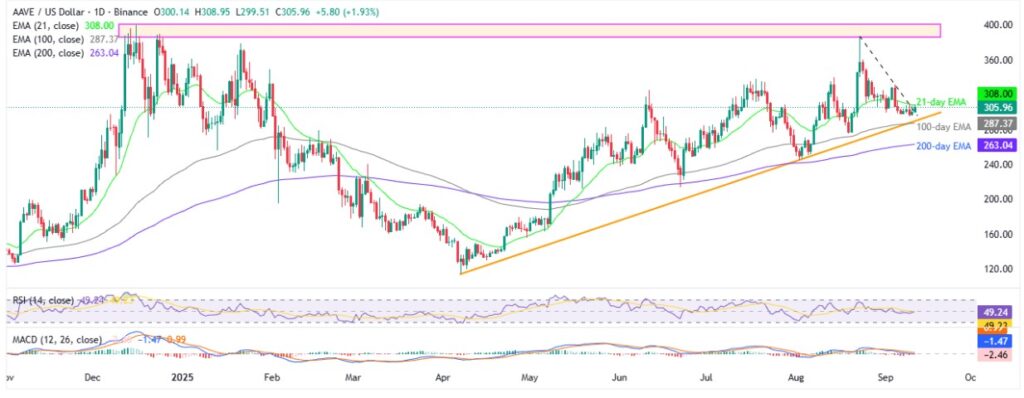
Still, 21-day Exponential Moving Average (EMA) guards AAVE’s immediate upside amid steady 14-day Relative Strength Index (RSI) and mixed signals from the Moving Average Convergence and Divergence (MACD) momentum indicators.
The altcoin’s latest struggle could also be linked to the market’s positioning for today’s U.S. Consumer Price Index (CPI) and the next week’s Federal Reserve (Fed) Interest Rate Decision.
However, sturdy trading volume and a week’s high of the market capitalization (market cap) seem to be underpinning the coin’s upside bias, especially when backed by Wednesday’s breakout and sustained trading beyond the long-term EMAs. According to Santiment, Aave’s daily trading volume remains sidelined near a week’s high surrounding $460.86 million, whereas the market cap renews weekly top around $4.63 billion at the latest.
With this, the AAVE buyers are on track to reverse the yearly loss, currently around 1.0%, but adding to the gains will be tough unless staying past $400.00, Read details!
Aave Price: Daily Chart Suggests Gradual Run-Up

Aave’s successful breakout of a two-week resistance line, now support around $298.00, joins steady RSI and sustained trading beyond the 100-day and 200-day EMAs to keep buyers hopeful.
Though a daily closing beyond the 21-day EMA hurdle surrounding $308.00 becomes necessary for AAVE buyers to add to the weekly gains, the first in three.
Beyond that, the quote’s run-up to the monthly high of $332.00 and July’s peak near $338.00 could be quick to witness.
Multiple hurdles around $360.00 and $370.00 will make it tough for the AAVE bulls to keep reins past $338.00.
Above all, a broad nine-month horizontal region between $386.00 and $400.00 will be the final line of defense for the AAVE bears, a break of which would shift the market’s attention toward the late 2021 high surrounding $478.00.
Alternatively, the altcoin’s failure to provide a daily close beyond $308.00 could drag it back to the previous resistance line surrounding $298.00.
However, a convergence of the 100-day EMA and a five-month-old rising trend line, close to $287.00, will precede the 200-day EMA support of $263.00 to restrict the AAVE’s further downside.
If the quote drops beneath the $263.00 support, it becomes vulnerable to reverse the advances from May, highlighting the yearly low of $114.00, with June’s low of $213.00 and the $200.00 threshold likely acting as intermediate halts.
Aave Price: Four-Hour Chart Points To Multiple Upside Hurdles

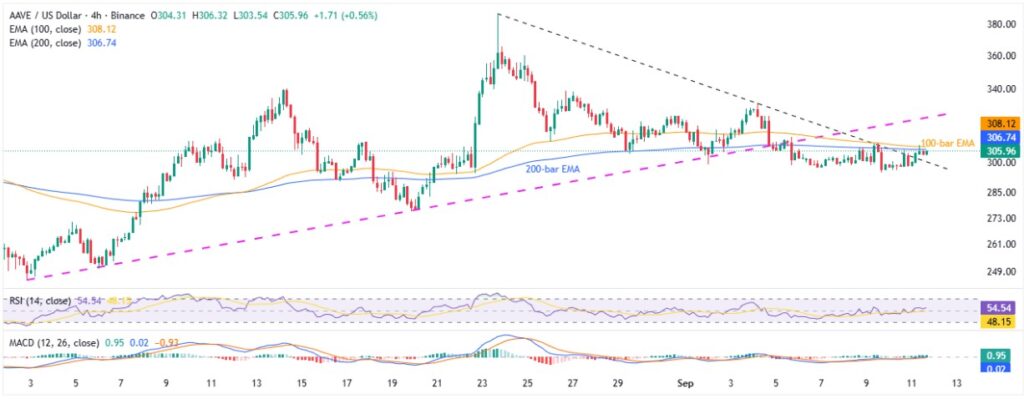
On the four-hour chart, Aave buyers jostle with a convergence of the 100 and 200-bar EMAs, near $308.00, following a successful breakout of a two-week resistance line, now support near $298.00.
Notably, the RSI and the MACD signals are comparatively more bullish on the four-hour chart than the daily, suggesting a short-term upside bias.
This could help AAVE buyers to cross the immediate resistance around $308.00 and allow prices to aim for a five-week support-turned-resistance near $325.00.
Given the altcoin’s successful trading beyond $325.00, higher levels discussed on the daily chart will be in the spotlight.
Meanwhile, a downside break of $298.00 might catch a breather around the weekly low of $295.00 before targeting the daily chart’s deeper levels.
Conclusion
Aave’s trendline breakout, sustained trading beyond key EMAs, and upbeat momentum indicators boost the chance of reversing its yearly loss. However, the $386.00-$400.00 region is a gate-keeper for witnessing yearly gains.
Also read: Cryptocurrency Weekly Price Prediction: BTC, XRP Rebound, But ETH Lags, amid Fed Rate Cut Buzz


