- Avalanche price stays firmer at a 7.5-month high, but multi-month resistance and pre-Fed anxiety test bulls.
- Bullish breakout from its February range and sustained trading above 200-day EMA defend upside bias despite the latest struggle.
- AVAX faces several upside hurdles, but buyers can stay in the game as long as $24.00 holds.
- Avalanche may witness short-term consolidation alongside the run-up to reverse yearly loss.
Avalanche (AVAX) price jumps 2.0% to $30.60 on Tuesday, poking a multi-month technical resistance amid the market’s preparations for the Federal Open Market Committee (FOMC) monetary policy announcements.
AVAX buyers face a 10-month horizontal resistance region and overheated stochastic conditions while bracing for the U.S. central bank’s rate cut signal, a potential positive for the crypto market.
Still, Avalanche’s previous bullish breakout of a February trading range and sustained recovery from the 200-day Exponential Moving Average (EMA) defend the upside bias.
On the same line, sturdy trading volume and a 7.5-month high market capitalization (market cap) also underpin a bullish outlook about the altcoin. According to Santiment, Avalanche’s daily trading volume stays upbeat near $1.19 billion, whereas the market cap jumps to the highest since early February, to $12.9 billion at the latest.
With this, the AVAX price may witness a short-term health consolidation while staying on the way to reverse the yearly loss, currently around 13%.
Avalanche Price: Daily Chart Suggests Short-term Consolidation

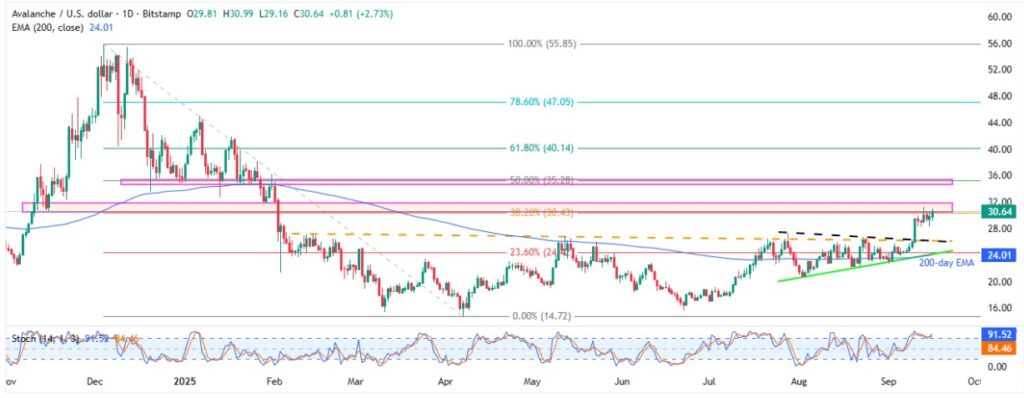
Multiple hurdles marked since November 2024 and 38.2% Fibonacci retracement of Avalanche’s late 2024 to April 2025 fall challenge bulls between $30.40 and $32.00. The multi-month resistance also draws strength from overheated conditions of the stochastic momentum indicator, well past the 80.00 upper boundary.
Still, a successful breakout of a 1.5-month-old symmetrical triangle, as well as a descending resistance line from February, keeps AVAX bulls hopeful.
Hence, AVAX buyers need to provide a daily close beyond $32.00 to avoid a short-term consolidation in price. Even so, a 50% Fibonacci ratio and a nine-month horizontal zone surrounding $34.50-$35.30 could challenge the quote’s further advances.
In a case where the altcoin stays firmer past $35.30, a gradual run-up toward the 61.8% Fibonacci retracement level at $40.15, known as the golden Fibonacci ratio, and then to the yearly high near $45.00 cannot be ruled out.
Alternatively, Avalanche’s retreat might aim for the latest bottom surrounding $28.30 before approaching the key resistance-turned-support confluence near $26.20, comprising the short-term triangle’s top and a multi-month falling trendline.
Following that, a convergence of the 200-day EMA and a six-week ascending support line, close to $24.00, will be the last line of defense for the AVAX bulls.
Should the altcoin remain weak past $24.00, the previous monthly low near $20.65, June’s bottom of $17.10, and the yearly trough surrounding $14.65 will be in the spotlight.
Avalanche Price: Four-Hour Chart Highlights Multiple Trading Filters

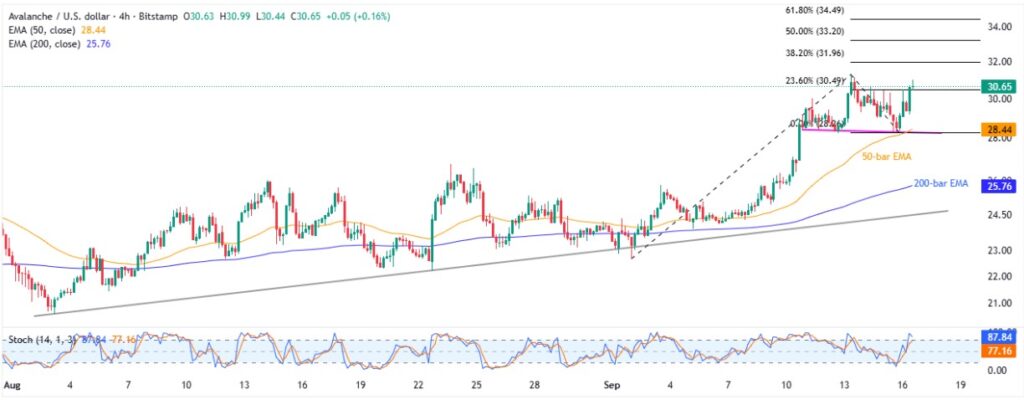
On the four-hour chart, Avalanche stays firmer past a week-long horizontal support and the 50-bar EMA while approaching Saturday’s multi-month peak near $31.30.
Beyond that, the 38.2% Fibonacci Extension (FE) of this month’s moves will join the key resistance boundary surrounding $32.00 to challenge the AVAX bulls. Breaking this level will highlight the 50.0% and 61.8% FE hurdles for the buyers, respectively near $33.20 and $34.50, ahead of the higher levels mentioned on the daily chart.
Conversely, the 50-bar EMA and the weekly horizontal support could stop the short-term AVAX downside near $28.45 and $28.30.
After that, the late August swing high around $26.75 and the 200-bar EMA support of $25.75 could test the sellers before directing them to the key support around $24.00, comprising an ascending trendline from early August.
Notably, a slew of deeper levels, discussed on the daily chart, could test the AVAX bears past $24.00, even as they keep the reins.
Conclusion
Avalanche price gains strength from a technical breakout and positive fundamentals, but multi-month resistance and an overheated stochastic oscillator challenge buyers. This defends the hopes of witnessing a gradual reversal of the yearly loss, even with intermediate pullbacks.
For more details, check out our Coin Bytes.


