- Avalanche extends week-start pullback toward key horizontal support.
- AVAX/USD stuck below key resistances as momentum stays weak—bears stay active.
- AVAX faces strong support layers on path to record low; recovery unlikely below $27.00.
Avalanche (AVAX/USD) fell to an intraday low near $17.30 on Tuesday, extending losses for a second day and erasing its late June rebound from key support. With this, AVAX is now down over 51% in 2025, facing pressure after two consecutive months of decline.
Besides the AVAX/USD pair’s failure to hold above the four-month-old support zone, a sustained trading below key resistance and weak signals from the Moving Average Convergence Divergence (MACD) and 14-day Relative Strength Index (RSI) keep sellers focused on retesting this support.
However, any move below $15.30 is likely to face several hurdles before approaching the record low marked in September 2023.
AVAX/USD: Daily Chart Directs Bears to $15.30

Source: TradingView
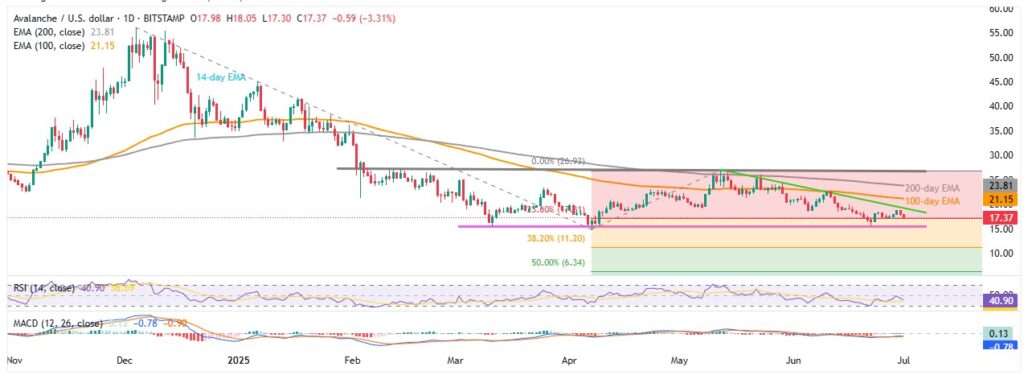
Avalanche’s pullback aligns with the 14-day RSI near 40 and weak MACD signals, pointing to further downside toward the four-month-old horizontal support zone around $15.65–$15.30, followed by the yearly low near $14.67.
If the RSI drops below the oversold threshold of 30, it could slow the bears near these supports. Otherwise, the 38.2% and 50% Fibonacci Extensions of the December-May move, around $11.20 and $6.34, will be key levels to watch.
Additional downside barriers include the $10.00 round number and the record low of $8.64 from September 2023.
On the upside, a seven-week-old descending resistance line near $19.30, alongside the $20.00 level, limits short-term recovery. Beyond that, the 100-day and 200-day EMA at $21.15 and $23.85, plus a five-month horizontal resistance near $26.90–$27.00, will challenge any bullish moves.
AVAX/USD: Four-Hour Chart Highlights Bearish Channel

Source: TradingView
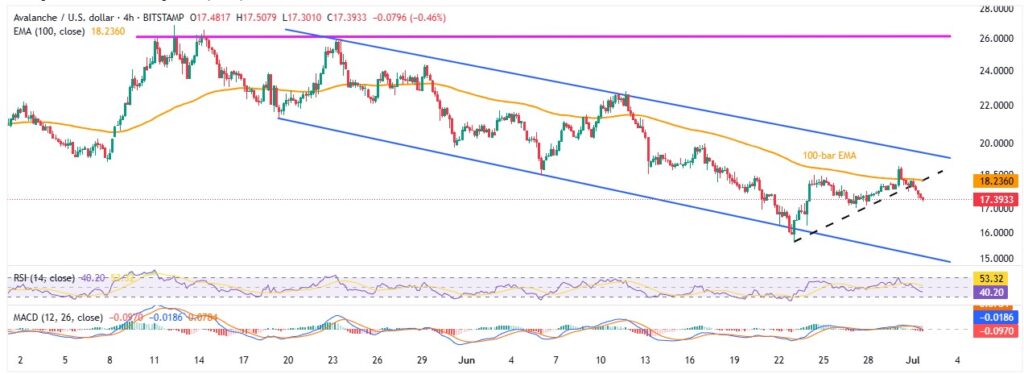
On the four-hour chart, AVAX/USD’s recent drop follows a break below a week-long support line and a clear reversal from the 100-bar EMA, currently converging near $18.25. The downward trend is also supported by a declining RSI that is not yet oversold, and bearish signals from the MACD.
However, a six-week-old bearish channel, currently between $15.10 and $19.60, seems to be limiting Avalanche’s short-term moves.
If traders manage to break out of this channel, key daily chart levels will come into focus.
Overall, Avalanche looks set to revisit its important horizontal support and could test the yearly low, but a drop to the record bottom seems less likely.


