- Avalanche softens after support-driven rebound, still on track for first weekly rise in three weeks.
- AVAX faces near-term resistance at 14-day EMA, with $27.00 acting as key breakout level for a sustained uptrend.
- AVAX/USD risks revisiting all-time lows if $14.60 support fails.
- Recovery from support and strengthening momentum favor short-term bulls, but the larger bearish structure remains intact.
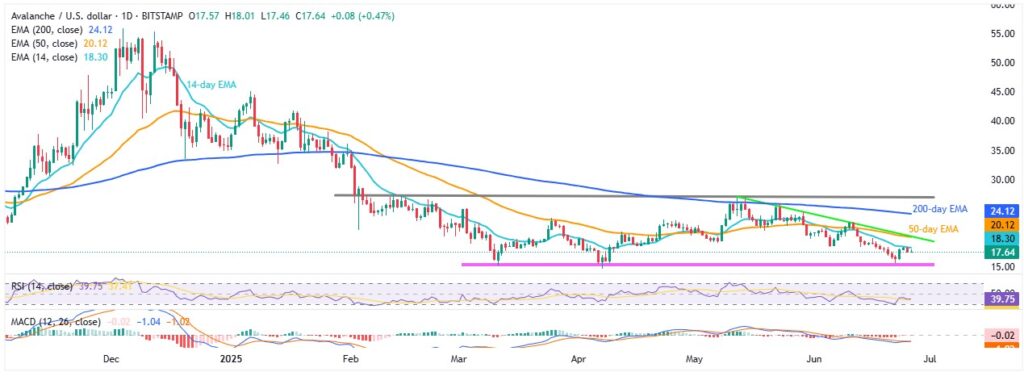
Avalanche (AVAX/USD) trades defensively around $17.67 during Thursday’s European session, easing off after a short-lived two-day rally. The decline began after AVAX failed to break above the 14-day Exponential Moving Average (EMA), which acted as a technical ceiling on Wednesday. Earlier this week, the pair had bounced from a crucial 15-week-old horizontal support zone, sparking hopes of a stronger recovery.
Despite the setback, a gradual uptick in the 14-day Relative Strength Index (RSI) and an impending bullish crossover on the Moving Average Convergence Divergence (MACD) indicator continue to fuel hopes of AVAX securing its first weekly gain in three.
AVAX/USD: Daily chart defends recovery hopes

Source: Tradingview
Looking at Avalanche’s rebounds from the aforementioned horizontal support zone since early March—especially under similar RSI and MACD conditions—there’s a fair chance AVAX/USD could overcome its immediate resistance at the 14-day EMA, currently around $18.30.
However, a confluence of the 50-day EMA and a six-week-old descending trendline near $20.10–$20.30 is likely to pose a stronger challenge, ahead of the more formidable 200-day EMA barrier at $24.20. Beyond that, a horizontal resistance zone formed since early February, around $27.00, remains the key level to watch for a potential trend reversal in AVAX’s broader downtrend from late 2024.
On the flip side, any fresh pullback may bring the multi-day-old horizontal support near $15.70–$15.30 back into play, followed by the yearly low at $14.60. Should AVAX breach the $14.60 mark—regardless of a likely oversold RSI by then—attention may shift to the record low from late 2023, around $8.80.
AVAX/USD: Four-Hour chart portrays bearish channel

Source: Tradingview
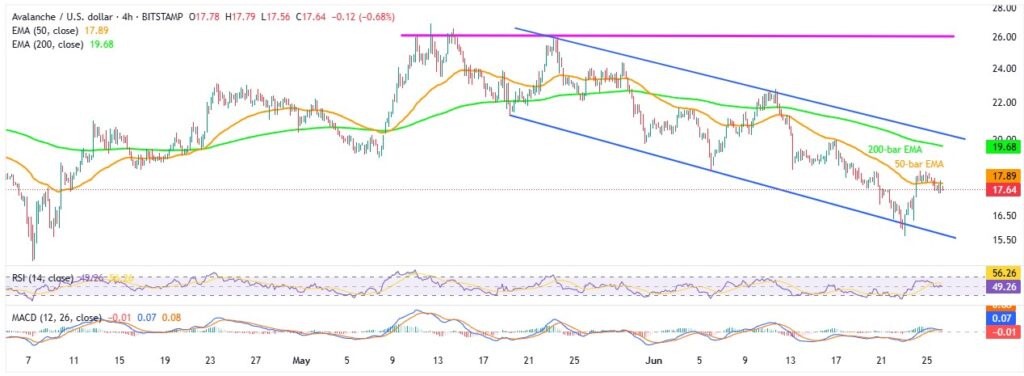
Unlike the daily chart, the four-hour chart of the AVAX/USD pair reveals a five-week-old bearish trend channel. This setup, combined with the recent pullback in the RSI and fading bullish momentum on the MACD, suggests a slower grind to the downside. Adding to the bearish tone, AVAX has recently slipped below its 50-bar EMA, reinforcing the short-term downward bias.
Given this backdrop, sellers may target the lower boundary of the bearish channel, located near $15.70, before confronting the broader support levels outlined on the daily chart.
Alternatively, a recovery above the 50-bar EMA at $17.90—closely followed by the $18.00 mark—may offer limited relief, as strong resistance awaits. The 200-bar EMA near $19.70 and the upper boundary of the bearish channel around $20.50 will likely cap any bullish attempts before AVAX can approach the resistance zones highlighted on the higher timeframes.
Overall, Avalanche faces challenges in extending its recent recovery, though a complete reversal of the weekly gains appears unlikely for now.


