- Avalanche price strongly rebounds from 200-day EMA to erase Thursday’s sharp drop.
- Momentum indicators suggest continuation of six-month trading range, with slight bullish tilt.
- AVAX bulls face strong resistance near $26.35, while pullback remains elusive beyond $20.60.
- Avalanche’s multi-month range is at risk if short-term recovery breaks the key resistance.
Avalanche (AVAX) price jumps 7.0% intraday to $25.30 early Friday, staging a sharp rebound after Thursday’s pullback from a two-week high.
In doing so, the Altcoin bounces off the 200-day Exponential Moving Average (EMA), fueled by news that U.S.-based equity tokenization firm Dinari has rolled out a Layer-1 blockchain network built on the Avalanche platform.
Read Details: Dinari rolls out Avalanche-powered network for tokenized U.S. stocks
AVAX’s rebound from the 200-day EMA, backed by positive news, pushed the daily trading volume to $1.41 billion, the highest since February, according to Santiment. The coin’s market cap recovers to $10.67 billion and signals strong liquidity and growing buyer confidence.
Still, multiple key resistances and momentum indicators challenge the Avalanche buyer’s ambition to break the six-month-old trading range.
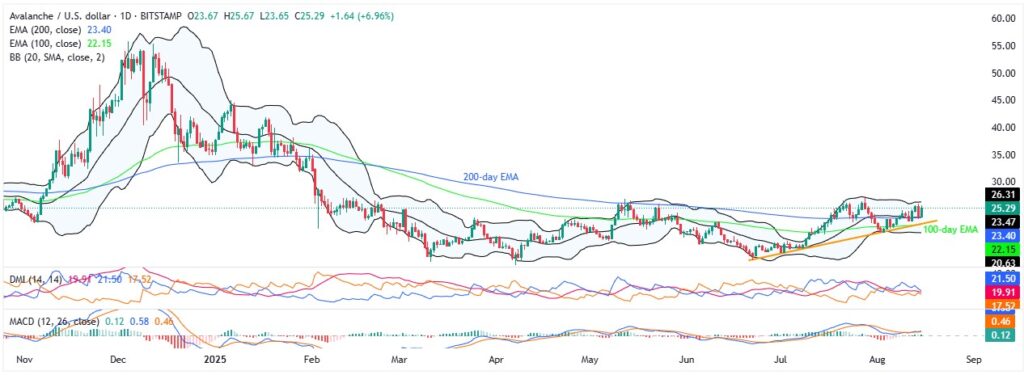
Avalanche Price: Daily Chart Highlights Challenges for Bulls

Avalanche’s U-turn from the 200-day EMA and middle Bollinger Band (BB) gains mild support from the momentum indicators, suggesting the market’s doubts about the latest rally.
That said, the Directional Movement Index (DMI) struggles in defending a bullish bias, as the Upmove line (blue) remains below the 25.00 neutral threshold, holding near 21.00 at the latest. The Average Directional Index (ADX) line (red) also stays weak around 19.00, raising doubts over the strength of bullish momentum.
Similarly, the Moving Average Convergence Divergence (MACD) signal (green) has been mostly sluggish, despite showing slight firmness lately, keeping AVAX’s upside bias under pressure.
This highlights the $26.35 resistance, comprising the upper BB and multiple tops marked since February, as a tough nut to crack for the AVAX bulls.
Apart from $26.35, the $27.00 threshold and July’s high of $27.37 could also challenge Avalanche’s upside before directing prices toward the $30.00 threshold and beyond, as well as aim to reverse the yearly loss, currently around 28%. In doing so, lows marked in January around $31.80 and $32.70 will gain the market’s attention.
Alternatively, a daily closing beneath the 200-day EMA and the middle BB, close to $23.45-$23.40, will attack $22.15 support confluence, including the 100-day EMA and an upward-sloping trend line from late June.
Following that, the lower BB near $20.60 and the $20.00 round figure will be the last defense of the AVAX bulls.
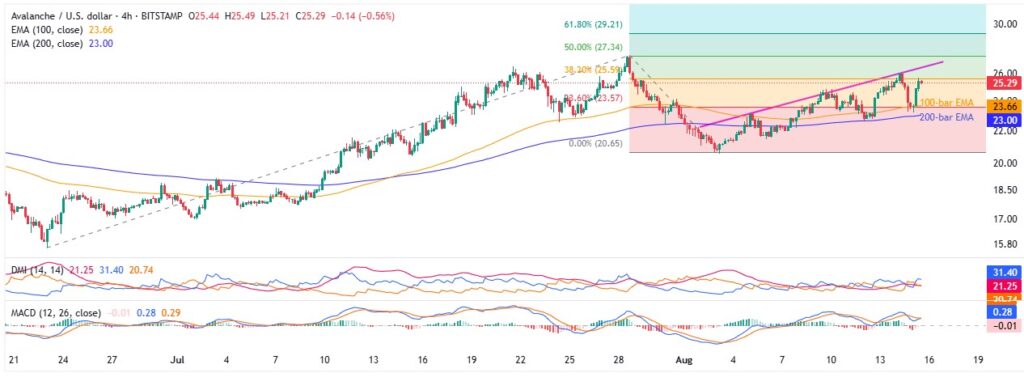
Avalanche Price: Four-Hour Chart Suggests Multiple Upside Hurdles

Unlike the daily chart, the DMI is more bullish on the four-hour chart as Avalanche bounces off the 100-bar EMA. However, the MACD is yet to regain the bullish territory and hence test the buyers.
With this, a week-long rising trend line resistance, close to $26.50, guards the immediate upside of the AVAX, apart from the $26.35 discussed earlier.
Beyond that, July’s peak of $27.37 and 61.8% Fibonacci Extension (FE) of the AVAX’s June-August moves, near $29.20, close to the $30.00 threshold, will gain the bull’s attention.
Meanwhile, a downside break of the 100-bar EMA of $23.66 will need validation from the 200-bar EMA of $23.00 and the monthly low of $20.60 to target the deep levels discussed on the daily chart.
Conclusion
Avalanche benefits from solid technical support and upbeat news, yet lacks the bullish momentum to break its six-month trading range. That said, a $26.35 breakout could pave the way for AVAX to erase its 27% yearly loss.
Hence, the altcoin is currently at the make-or-break level and requires caution while trading for short term.


