- Avalanche posts fourth straight daily loss, challenging key six-week support at its lowest since early April.
- RSI points to short-term AVAX rebound, but weak MACD and rejections from EMA resistances cap recovery momentum.
- Reversal of December-April downturn hinges on $27.00 breakoout, with the $15.60–$15.30 area acting as final support filter.
Avalanche (AVAX/USD) bears continue to pressure a key short-term support during a four-day losing streak, with the pair trading around $18.00 — down 0.95% intraday — during Thursday’s European session. The decline has brought AVAX/USD to its lowest level in 10 weeks, following repeated rejections from key Exponential Moving Averages (EMAs) since May.
However, the 14-day Relative Strength Index (RSI) is nearing the oversold threshold and trending lower, signaling possible exhaustion of the recent bearish momentum. Despite this, the Moving Average Convergence Divergence (MACD) indicator continues to flash bearish signals, which may keep AVAX sellers active in the near term.
AVAX/USD: Daily chart portrays bearish exhaustion

Source: Tradingview
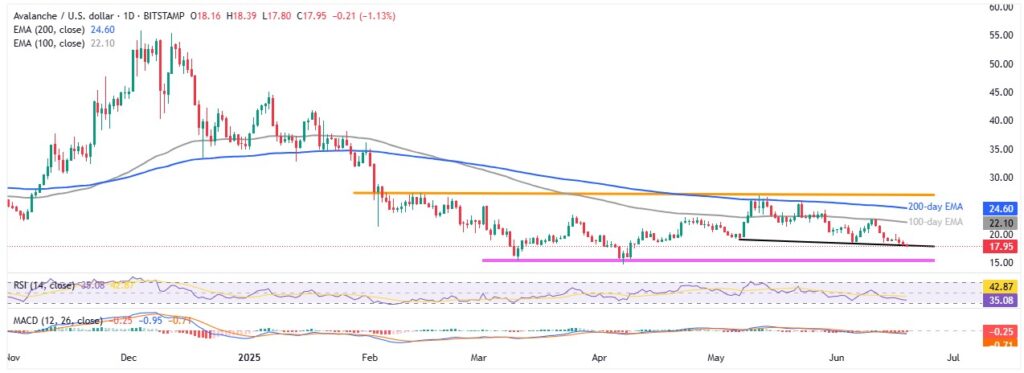
Avalanche bears are pressing against a downward-sloping trendline support extending from early May, currently located around $18.00. This action continues to lure sellers, supported by the RSI remaining above oversold territory and the presence of bearish signals from the MACD indicator. Additionally, multiple rejections from the 100-day and 200-day EMAs reinforce the likelihood of a breakdown below the immediate trendline support.
Should that breakdown occur, AVAX/USD could fall further toward a strong horizontal support zone marked by levels seen since March, around $15.30–$15.60. However, this zone may prove difficult for bears to breach, particularly if the RSI enters oversold conditions.
A sustained move below $15.30 would expose the yearly low of $14.67 as the last major defense for buyers. If that fails, the next downside targets include the $10.00 psychological level and the late 2023 bottom near $8.80.
On the flip side, if AVAX stages a recovery, initial resistance is likely near the 100-day and 200-day EMAs, currently around $22.10 and $24.60, respectively. A break above these levels would bring focus to a 4.5-month-old horizontal resistance area around $26.80–$27.00.
A successful daily close above $27.00 would mark a significant bullish shift, potentially reversing the downtrend that began in December 2024. The $30.00 level would then act as an additional upside filter.
AVAX/USD: Four-Hour chart signals imminent bounce

Source: Tradingview
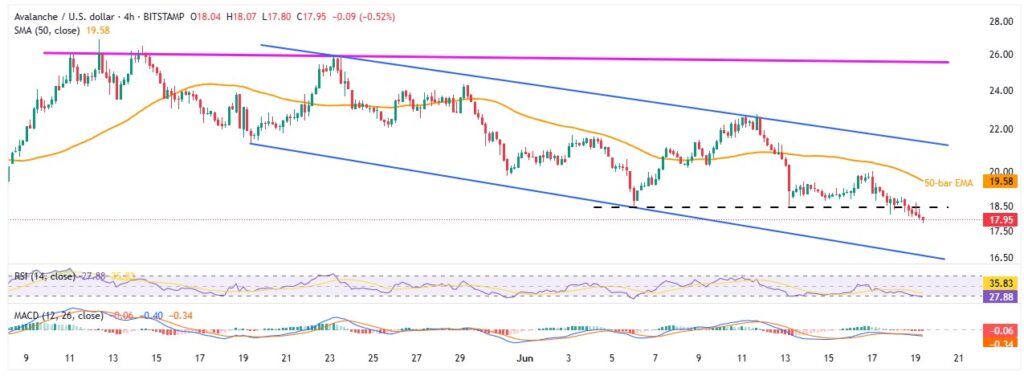
Unlike the daily chart—where the RSI still has room before entering oversold territory and the MACD remains bearish—the four-hour chart paints a slightly different picture. Here, the RSI is beneath the oversold threshold of 30.00.
However, the MACD signals are still bearish and a clear downside break of fortnight-old horizontal support, now immediate resistance near $18.45, suggesting a continuation of the recent downtrend.
That said, the lower boundary of the mentioned bearish channel, located around $16.60 at the time of writing, acts as strong challenge for the AVAX bears before the price revisits the key support levels highlighted on the daily chart.
Alternatively, the Aavalanche recovery faces multiple upside barriers. Among them, the support-turned-resistance line near $18.45 and the 50-bar EMA near $19.60 gain immediate attention of buyers during a corrective bounce.
Following that, the top of a month-old bearish channel around $21.50 will likely cap the AVAX/USD pair’s gains. Beyond that, a five-week-old horizontal resistance near $25.60 presents a stronger hurdle for bulls.
To sum up, AVAX/USD remains in a bearish structure, but downside potential appears limited in the near term as oversold signals begin to build.


