- Avalanche price rebounds from a 10-day low, with the symmetrical triangle pattern providing key support.
- Flat RSI and sluggish MACD signals hint at limited short-term momentum for AVAX.
- A clear break above $26.70 could help AVAX bulls reverse yearly losses, while the 100-day EMA offers additional downside support.
- Short-term recovery looks likely as AVAX trades within a broad consolidation pattern.
Avalanche (AVAX) price gains 2.0% intraday to $23.80 ahead of Monday’s New York trading session, bouncing back from a near two-week low hit earlier in the day.
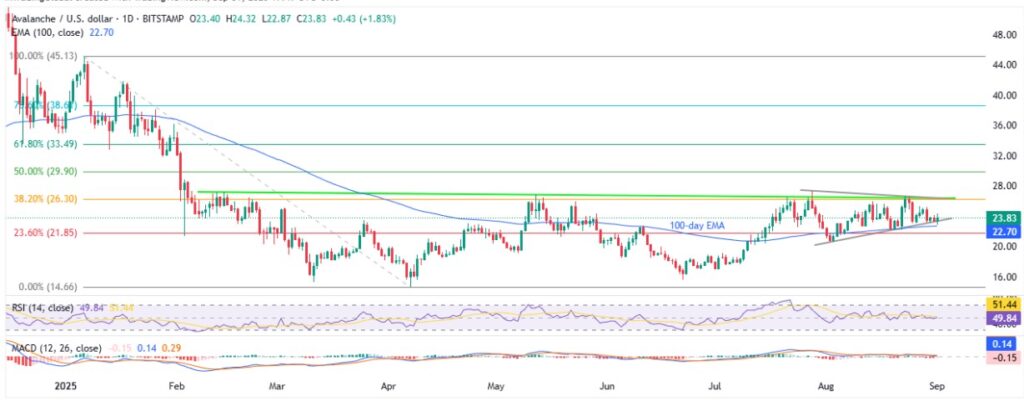
With this, the AVAX coin confirms a five-week symmetrical triangle formation, while also bouncing off the 100-day Exponential Moving Average (EMA) support. Adding strength to the recovery moves is the neutral 14-day Relative Strength Index (RSI) and sluggish signals from the Moving Average Convergence Divergence (MACD) momentum indicators.
Notably, an uptick in the trading volume, following a two-day reduction, joins the improvement in the AVAX market capitalization, to also underpin the rebound and lures short-term buyers. According to Santiment, Avalanche’s daily trading volume hit a three-day high of $523.94 million, whereas the market cap also rises to $10.08 billion from $9.89 billion.
Elsewhere, a jump in the Avalanche’s weekly transactions by 66%, due to news surrounding the U.S. Commerce Department and AVAX ETF, add strength to the recovery bias.
For more updates like this, check out our Crypto Bytes.
Still, a broad bearish trend line joins the stated triangle’s top to challenge the AVAX bulls, targeting a reversal of the yearly loss, currently around 33%.
Avalanche Price: Daily Chart Highlights Broad Consolidation Pattern

A clear reversal from the 100-day EMA and short-term triangle support joins steady RSI and sluggish MACD to suggest a slow run-up in the AVAX price, highlighting the late August swing high surrounding $25.30.
However, a convergence of the stated triangle’s top and a downward-sloping resistance line from February, close to $26.70, appears to be a tough nut to crack for the Avalanche buyers.
If they manage to cross the $26.70 hurdle, July’s peak of around $27.40 and early February swing near $28.80 might test the bulls before directing them to the 50% and 61.8% Fibonacci retracement of its January-April downside, respectively near $29.90 and $33.50.
Beyond that, January’s low around $31.80 will be the bull’s breathing point during the run to reverse the yearly loss.
On the contrary, the triangle’s bottom and the 100-day EMA restrict short-term AVAX downside near $23.40 and $22.70 in that order.
In a case where the Avalanche sellers keep the reins past $22.70, the 23.6% Fibonacci ratio of $21.85 and the previous monthly low of $20.60, quickly followed by the $20.00 psychological magnet, could stall them before lows marked in June and April, near $15.60 and $14.65 respectively.
Avalanche Price: Four-Hour Chart Points To Triangle Formation

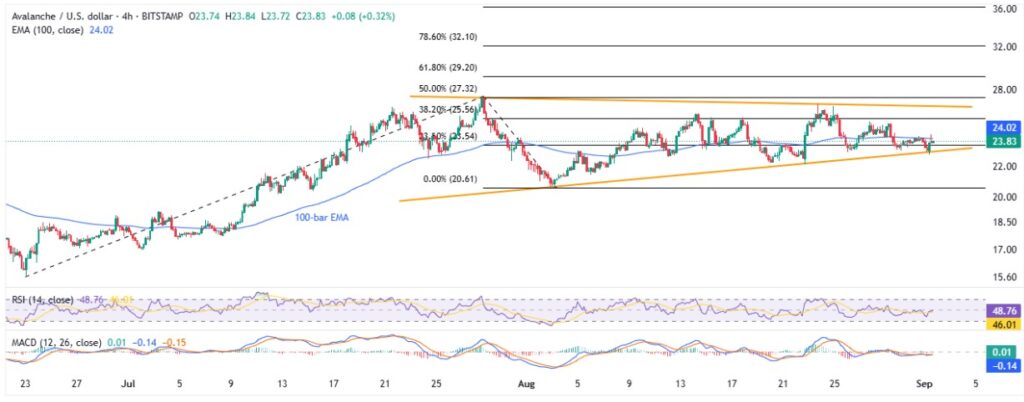
A five-week symmetrical triangle restricts immediate AVAX moves on the four-hour chart, currently between $23.40 and $26.70. That said, the 100-bar EMA surrounding $24.00 guards the quote’s immediate recovery.
Meanwhile, a downside break of $23.40 could direct AVAX sellers toward the previous monthly low of $20.60, the $20.00 round-figure and other key support levels mentioned on the daily chart.
Alternatively, an upside clearance of $26.70 could aim for the 50% and 61.8% Fibonacci Extensions (FE) of AVAX’s June-August moves, respectively near $27.35 and $29.25, ahead of the higher levels discussed on the daily chart.
Conclusion
Avalanche price continues to defend its six-month trading range, supported by recent market-wide consolidation, which suggests potential for further recovery. However, the $26.70 may act as a strong resistance level and could prevent bulls from reversing the yearly loss.


