- Avalanche price pulls back from 200-day EMA, fading recovery from six-week support.
- Failure to cross key EMA joins unimpressive RSI, MACD conditions to suggest modest weakness in AVAX price.
- Avalanche’s short-term trend hinges on multi-week support line; six-month consolidation likely to prevail.
Avalanche (AVAX) price drops nearly 3.0% to $22.42 heading into Tuesday’s U.S. trading session, snapping a two-day winning streak while reversing from the 200-day Exponential Moving Average (EMA).
In doing so, AVAX fades the week-start recovery from a six-week ascending support line.
AVAX’s daily trading volume is 561.85 million, and the market cap is $9.50 billion according to Santiment.
The quote’s inability to break the key Exponential Moving Average (EMA) resistance, alongside bearish signals from the Moving Average Convergence Divergence (MACD) indicator and neutral conditions on the 14-day Relative Strength Index (RSI), suggests short-term price weakness.
Avalanche Price: Daily Chart Highlights Pullback Concerns

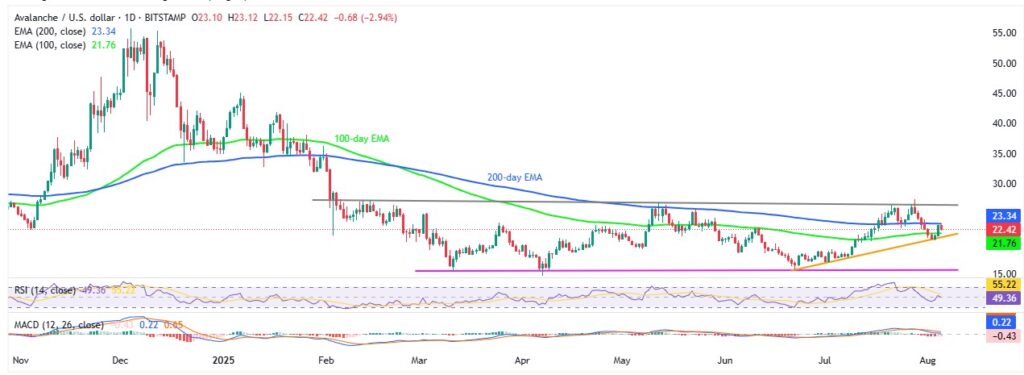
A clear reversal from the 200-day EMA, currently around $23.35, joins the bearish MACD signals and neutral RSI to suggest further weakness in the AVAX prices, highlighting a six-week-old support line surrounding $21.00 as the short-term key level to watch for bears.
Should the quote break the $21.00 support, the early-June swing low surrounding $19.00 might act as an intermediate halt before directing Avalanche sellers to the bottom line of a six-month trading range, near $15.50.
It’s worth mentioning that the yearly low of $14.67 acts as an additional downside filter for the AVAX sellers to aim past $19.00.
Meanwhile, Avalanche buyers need a daily closing beyond the 200-day EMA hurdle of $23.35 to retake control.
Even so, the upper boundary of the six-month trading range, close to $26.60, acts as a tough nut to crack for the AVAX bulls.
If the buying pressure remains sustained, the prices remain firmer past $26.60, July’s peak of $27.37 can test the advances targeting the $30.00 psychological magnet.
Avalanche Price: Four-Hour Chart Highlights Limited Downside Room

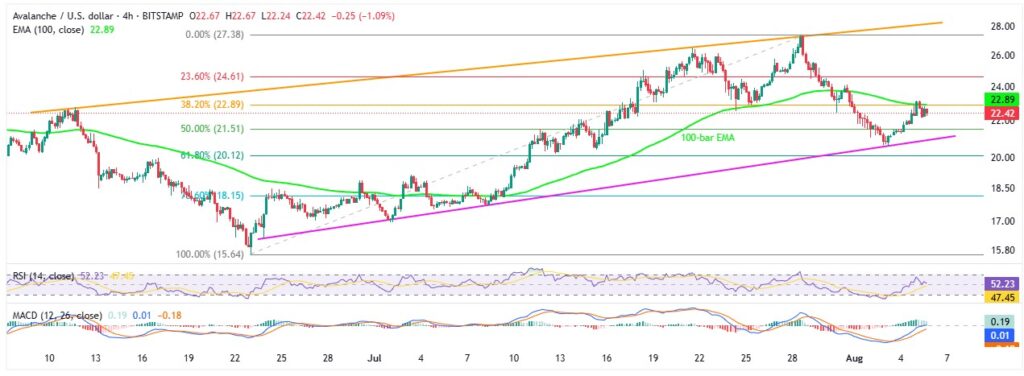
On the four-hour chart, Avalanche retreats from the 100-bar EMA to lure short-term sellers.
However, the RSI and MACD conditions are much stronger, which in turn challenges the odds of witnessing the quote’s downside past the six-week-old support surrounding $21.00.
Also acting as the short-term key support is the 61.8% Fibonacci retracement of the quote’s June-July rise, close to the $20.00 round figure.
Alternatively, an upside break of the 100-bar EMA surrounding $22.90 might trigger AVAX’s short-term recovery, targeting $26.50 and July’s peak of $27.37.
Still, an upward-sloping trend line from early June, close to $28.10, could challenge the bulls before directing them to the highest levels discussed on the daily chart.
Avalanche’s pullback from the 200-day Exponential Moving Average (EMA) dampens short-term recovery expectations, but a bearish trend will depend on a breakdown below $21.00. However, the six-month trading range could limit major moves, requiring traders to adjust their strategies within this range.


