- Avalanche price drops over 6.0% on a day, extending its pullback from six-month resistance.
- Failure to cross multi-month resistance and Stochastic pullback from overbought levels point to a continuation of short-term AVAX downside.
- Six-month consolidation remains intact; upside break of $26.50 can trigger a fresh bullish trend.
- Pullback from key resistance, normal Stochastic suggests further weakness in AVAX within its broad consolidation, with $22.50 as key support.
Avalanche (AVAX) price slides more than 6.0% intraday to $24.15 during Monday’s European session, extending its weekend retreat from the key resistance within a six-month-old trading range.
Avalanche’s latest pullback also takes clues from the Stochastic retreating from the overbought region and the market’s consolidation after gains driven by hopes of further U.S. Federal Reserve (Fed) rate cuts.
Upbeat trading volume adds weight to AVAX’s pullback, keeping short-term control with the sellers. Santiment data shows daily trading volume climbed to $1.02 billion from $898.27 million on Sunday, while market cap slipped for a second day after hitting a six-month high, near $10.23 billion at the latest.
With this, Avalanche’s U-turn from key resistance, rising trading volume, and neutral Stochastic hint at more downside within its multi-month range. Still, several key support levels may test the bears’ strength.
Avalanche Price: Daily Chart Points To Consolidation Pattern

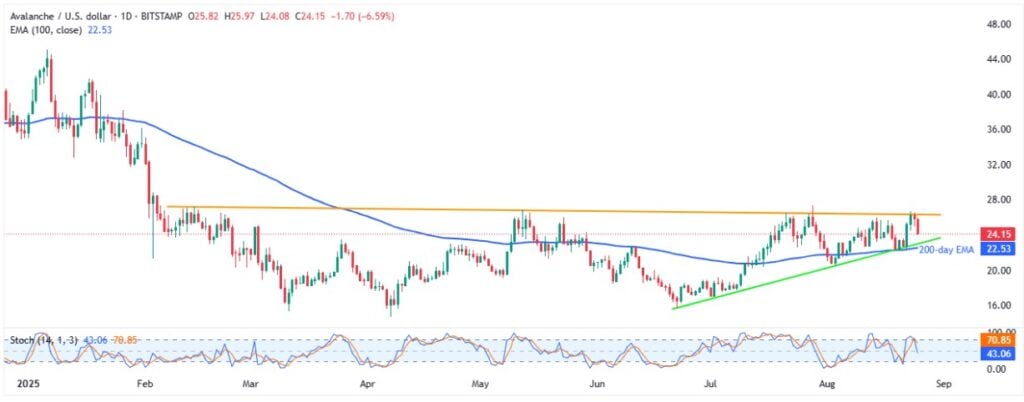
A clear reversal from the downward-sloping resistance line from early February joins the Stochastic indicator’s pullback from the overbought conditions of above 80.00 to please AVAX bears on Monday, suggesting further downside toward an ascending trend line support stretched from late June, close to the $23.00 threshold.
However, the 200-day Exponential Moving Average (EMA) level of $22.50 will be crucial to watch afterward as a clear break of the same could direct the quote Avalanche sellers toward the $20.00 psychological magnet, early June swing low of around $18.50, and then to the yearly low of $14.67. It should be noted that multiple supports around the $15.00 round figure can also test the AVAX sellers during their fall within the six-month consolidation.
On the upside, AVAX recovery remains elusive beneath the six-month resistance line, currently around $26.50. That said, the mid-month high around $26.00 guards the quote’s immediate upside.
Should Avalanche buyers manage to keep the reins past $26.50, July’s top near $27.40, the $30.00 threshold, and January’s low around $31.80 will be their breathing points during the run to reverse the yearly loss.
Avalanche Price: Four-Hour Chart Highlights Triangle Formation

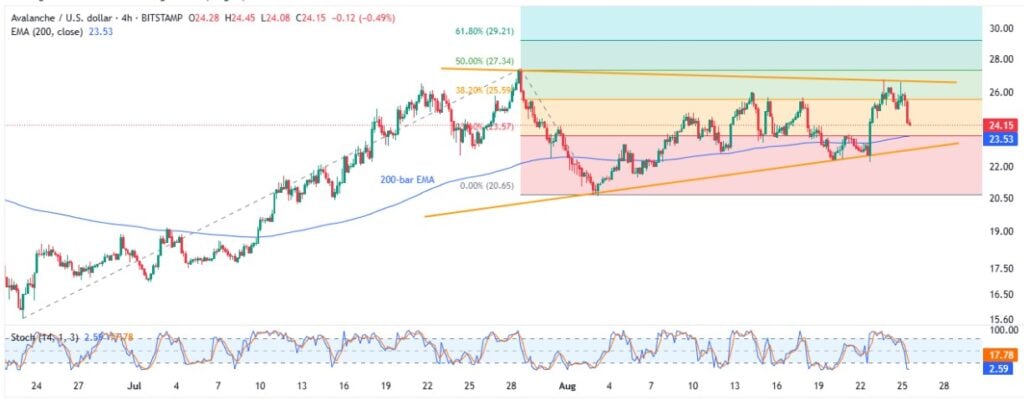
A four-week symmetrical triangle restricts immediate AVAX moves on the four-hour chart, currently between $22.80 and $26.70.
It’s worth noting, however, that the Stochastic is near the oversold territory of 20.00 and hence the 200-bar EMA support of $23.53 gains weight within the triangle.
Meanwhile, a downside break of $22.80 could direct AVAX sellers toward the monthly low of $22.60 before highlighting the $22.50 and other key support levels mentioned on the daily chart.
Alternatively, an upside clearance of $26.70 could aim for the 50% and 61.8% Fibonacci Extensions (FE) of AVAX’s June-August moves, $27.35 and $29.25, respectively, ahead of the higher levels discussed on the daily chart.
Conclusion
Avalanche price continues to defend its six-month trading range, supported by recent market-wide consolidation, which suggests potential for further downside. However, the 200-day EMA may act as strong support and could prevent bears from dragging the price down toward the range’s bottom, near the yearly low of $14.65.
Also read: SBI and Chainlink Team Up to Bring Tokenized Finance to Japan and Asia-Pacific


