- Avalanche pulls back from mid-May highs following three-day winning streak as overbought RSI and key resistance test bulls.
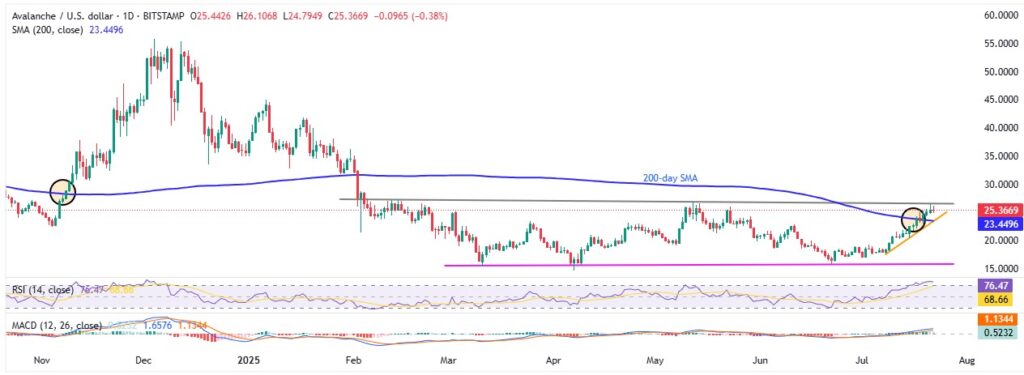
- Late 2024’s 97% rally after 200-day SMA breakout keeps bulls hopeful after last week’s similar move.
- Bullish MACD signals also keep AVAX buyer sentiment alive despite latest retreat.
- AVAX/USD bears need a break below $23.45 to gain control, while a sustained move above $26.50 could flip yearly loss.
Avalanche (AVAX/USD) trades in a consolidation phase near $25.30 during Tuesday, slightly retreating after marking its highest level since mid-May and snapping a three-day winning streak. Despite minor losses, the pair remains above the 200-day Simple Moving Average (SMA) and a two-week-old ascending support line — keeping the broader bullish structure intact.
Importantly, AVAX posted a 97% rally after breaking above the 200-day SMA in November 2024 — a historical move that fuels current buyer optimism following a similar breakout just last week.
That said, the 14-day Relative Strength Index (RSI) flashes overbought conditions and a multi-month resistance line tests bullish momentum but strong signals from the Moving Average Convergence Divergence (MACD) indicator continue to favor the upside.
AVAX/USD: Daily Chart Keeps Buyers Hopeful

AVAX/USD pulls back from key resistance near $26.50 and faces overbought RSI pressure, but bulls remain confident, defending last week’s breakout above the 200-day SMA. Bullish MACD and steady support from a two-week-old rising trend keep buyers hopeful.
A break above $26.50 could trigger a run toward $48.00 — echoing the 97% rally after the late 2024 200-day SMA breakout.
On the way to the $48.00 target, Avalanche may face resistance near $30.00 and $40.00, including the late January swing low around $40.80 and the yearly high at $45.00. Additional upside hurdles include the January 18 swing high at $41.80 and several January lows between $34.90 and $35.00.
On the downside, a break below the convergence of the 200-day SMA and two-week-old support near $23.45 could push AVAX toward June’s high around $22.75. Further support lies at the $20.00 psychological level and the early June swing low near $18.45, before testing the key March support line near $15.80.
AVAX/USD: Four-Hour Chart Signals Short-term Pullback

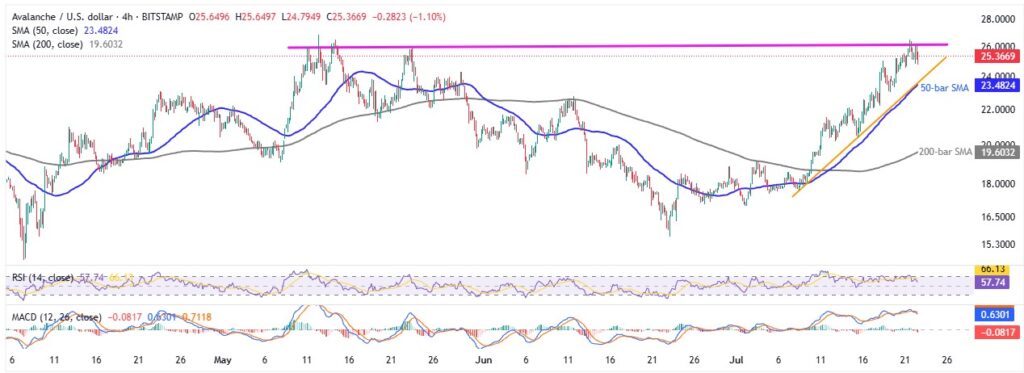
Avalanche hits 10-week resistance near $26.20–$26.25 on the four-hour chart, matching daily resistance around $26.50 but with RSI and MACD conditions signaling a possible short-term pullback.
The charts also show a key support zone near $23.45–$23.50, where the 50-bar SMA meets a two-week-old support line. A break below this level could push AVAX sellers toward the $20.00 psychological mark, followed by the 200-bar SMA near $19.60, before turning attention back to daily chart supports.
On the upside, the AVAX/USD pair’s move above $26.25 will need to clear the broader daily resistance near $26.50 to regain bullish control.
Overall, while Avalanche bulls pause near key resistance, the momentum for a fresh yearly high and a reversal of the 28% yearly loss remains intact.


